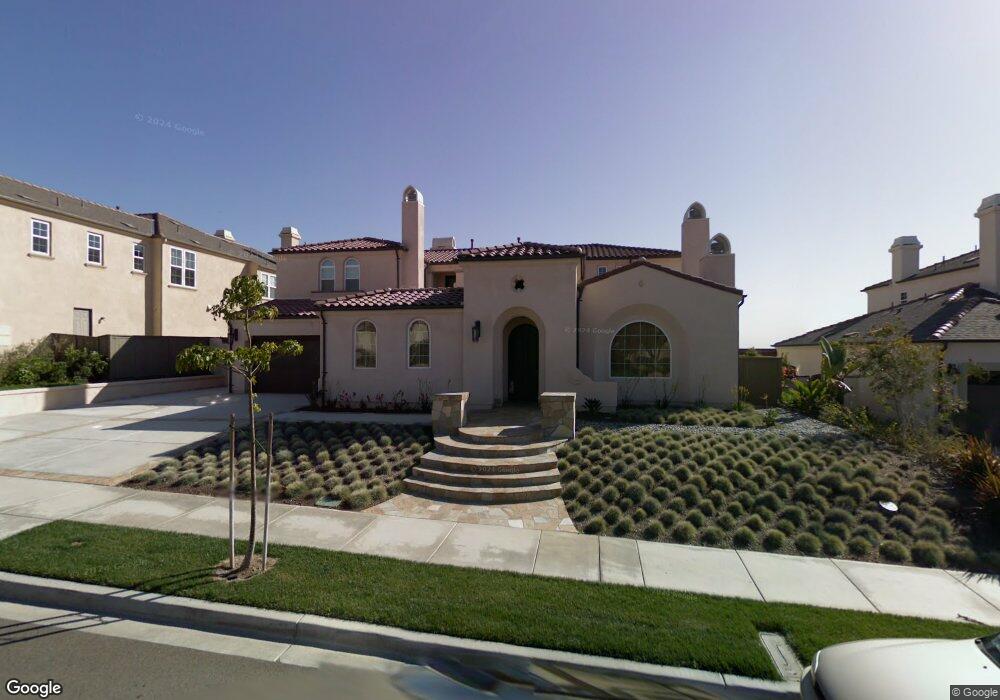
7615 Circulo Sequoia Carlsbad, CA 92009
La Costa NeighborhoodEstimated Value: $2,548,037 - $2,923,000
5
Beds
4
Baths
4,000
Sq Ft
$687/Sq Ft
Est. Value
About This Home
This home is located at 7615 Circulo Sequoia, Carlsbad, CA 92009 and is currently estimated at $2,748,259, approximately $687 per square foot. 7615 Circulo Sequoia is a home located in San Diego County with nearby schools including Mission Estancia Elementary School, Diegueno Middle School, and La Costa Canyon High School.
Ownership History
Date
Name
Owned For
Owner Type
Purchase Details
Closed on
Mar 25, 2008
Sold by
Pan Chenglan
Bought by
Pan Chenglan and Xia Daoxing
Current Estimated Value
Purchase Details
Closed on
Mar 21, 2008
Sold by
Xia Jingwei
Bought by
Xia Jingwei
Purchase Details
Closed on
Nov 29, 2006
Sold by
Chang Peter L D and Xia Jingwei
Bought by
Chang Peter L D
Purchase Details
Closed on
Aug 31, 2005
Sold by
Dw Oaks South Lp
Bought by
Chang Peter L D and Xia Jingwei
Home Financials for this Owner
Home Financials are based on the most recent Mortgage that was taken out on this home.
Original Mortgage
$80,000
Interest Rate
5.9%
Mortgage Type
Credit Line Revolving
Create a Home Valuation Report for This Property
The Home Valuation Report is an in-depth analysis detailing your home's value as well as a comparison with similar homes in the area
Home Values in the Area
Average Home Value in this Area
Purchase History
| Date | Buyer | Sale Price | Title Company |
|---|---|---|---|
| Pan Chenglan | -- | None Available | |
| Xia Daoxing | -- | None Available | |
| Xia Jingwei | -- | None Available | |
| Chang Peter | -- | None Available | |
| Xia Jingwei | -- | None Available | |
| Pan Chenglan | $312,500 | None Available | |
| Xia Daoxing | $312,500 | None Available | |
| Chang Peter | -- | None Available | |
| Chang Peter | -- | None Available | |
| Chang Peter L D | -- | None Available | |
| Chang Peter L D | $1,165,500 | Chicago Title Co |
Source: Public Records
Mortgage History
| Date | Status | Borrower | Loan Amount |
|---|---|---|---|
| Previous Owner | Chang Peter L D | $80,000 |
Source: Public Records
Tax History Compared to Growth
Tax History
| Year | Tax Paid | Tax Assessment Tax Assessment Total Assessment is a certain percentage of the fair market value that is determined by local assessors to be the total taxable value of land and additions on the property. | Land | Improvement |
|---|---|---|---|---|
| 2025 | $17,943 | $1,595,910 | $853,779 | $742,131 |
| 2024 | $17,943 | $1,564,619 | $837,039 | $727,580 |
| 2023 | $17,506 | $1,503,865 | $804,537 | $699,328 |
| 2022 | $17,145 | $1,503,865 | $804,537 | $699,328 |
| 2021 | $16,908 | $1,474,378 | $788,762 | $685,616 |
| 2020 | $16,678 | $1,459,261 | $780,675 | $678,586 |
| 2019 | $16,320 | $1,427,329 | $735,028 | $692,301 |
| 2018 | $15,957 | $1,399,343 | $720,616 | $678,727 |
| 2017 | $15,689 | $1,371,906 | $706,487 | $665,419 |
| 2016 | $15,217 | $1,345,007 | $692,635 | $652,372 |
| 2015 | $14,988 | $1,324,804 | $682,231 | $642,573 |
| 2014 | $14,685 | $1,298,854 | $668,868 | $629,986 |
Source: Public Records
Map
Nearby Homes
- 3514 Sitio Baya
- 7911 Terraza Disoma
- 7702 Caminito Tingo Unit H203
- Kestrel - Plan 4 at The Nest at La Costa
- Robin - Plan 3 at The Nest at La Costa
- Lark - Plan 1 at The Nest at La Costa
- Wren - Plan 2 at The Nest at La Costa
- Starling - Plan 5 at The Nest at La Costa
- 0 Lone Hill Ln
- 7310 Esfera St
- 3356 Corte Tiburon
- 3451 Dove Hollow Rd
- 3101 Levante St
- 3240 Piragua St
- 0000 Cadencia St Between 7402-7412 Unit 474
- 3008 Garboso St
- 1823 Sheridan Way
- 7925 Calle Madrid
- 8010 Calle Pinon
- 3112 Del Rey Ave
- 7611 Circulo Sequoia
- 7617 Circulo Sequoia
- 7607 Circulo Sequoia
- 7619 Circulo Sequoia
- 7614 Circulo Sequoia
- 7610 Circulo Sequoia
- 7621 Circulo Sequoia
- 7606 Circulo Sequoia
- 7602 Circulo Sequoia
- 7623 Circulo Sequoia
- 7633 Sitio Algodon
- 7337 Corte Tomillo
- 7598 Circulo Sequoia
- 7341 Corte Tomillo
- 7333 Corte Tomillo
- 7595 Circulo Sequoia
- 7625 Circulo Sequoia
- 7345 Corte Tomillo
- 7637 Sitio Algodon
- 7594 Circulo Sequoia