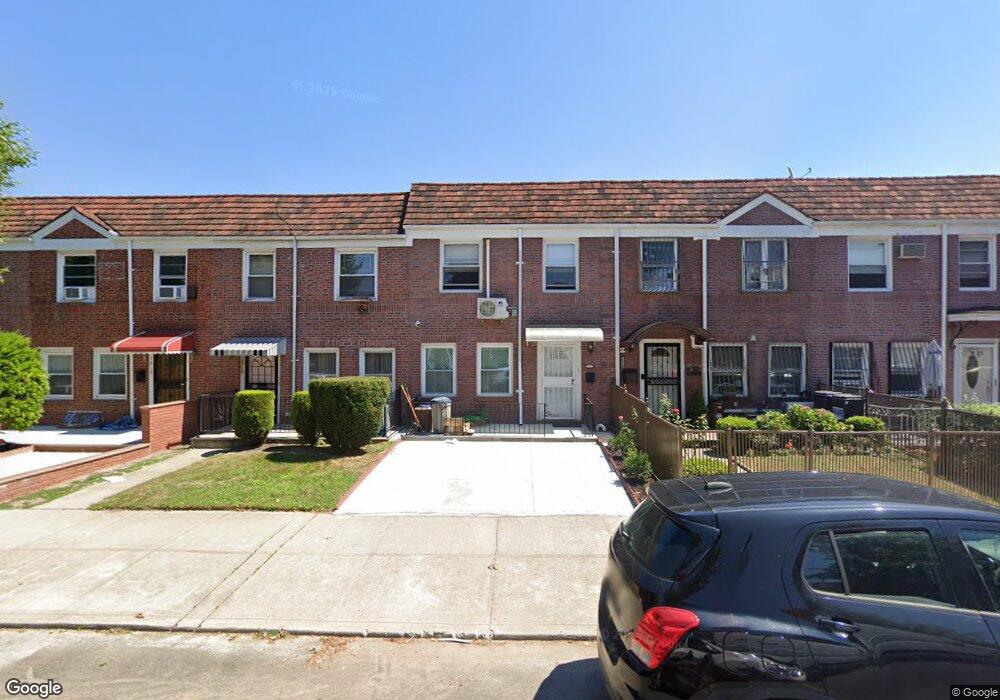
7617 169th St Fresh Meadows, NY 11366
Hillcrest NeighborhoodEstimated Value: $857,000 - $1,071,000
--
Bed
--
Bath
1,224
Sq Ft
$770/Sq Ft
Est. Value
About This Home
This home is located at 7617 169th St, Fresh Meadows, NY 11366 and is currently estimated at $942,837, approximately $770 per square foot. 7617 169th St is a home located in Queens County with nearby schools including P.S. 173 - Fresh Meadow, George J. Ryan Middle School 216, and St. Nicholas of Tolentine Catholic Academy.
Ownership History
Date
Name
Owned For
Owner Type
Purchase Details
Closed on
Aug 18, 2025
Sold by
Huang Yuqiong and Li Shaokun
Bought by
Li Shaokun
Current Estimated Value
Purchase Details
Closed on
Sep 20, 2017
Sold by
Huang Yuqiong
Bought by
Huang Yuqiong and Li Shaokun
Purchase Details
Closed on
Mar 5, 2013
Sold by
Skymark Development Llc
Bought by
Huang Yuqiong
Purchase Details
Closed on
Aug 13, 2012
Sold by
Of The Gress Family Trust and Stuart Gress As Trustee
Bought by
Skymark Development Llc
Create a Home Valuation Report for This Property
The Home Valuation Report is an in-depth analysis detailing your home's value as well as a comparison with similar homes in the area
Home Values in the Area
Average Home Value in this Area
Purchase History
| Date | Buyer | Sale Price | Title Company |
|---|---|---|---|
| Li Shaokun | -- | -- | |
| Huang Yuqiong | -- | -- | |
| Huang Yuqiong | $556,000 | -- | |
| Huang Yuqiong | $556,000 | -- | |
| Skymark Development Llc | $400,000 | -- | |
| Skymark Development Llc | $400,000 | -- |
Source: Public Records
Tax History Compared to Growth
Tax History
| Year | Tax Paid | Tax Assessment Tax Assessment Total Assessment is a certain percentage of the fair market value that is determined by local assessors to be the total taxable value of land and additions on the property. | Land | Improvement |
|---|---|---|---|---|
| 2025 | $7,501 | $39,584 | $11,180 | $28,404 |
| 2024 | $7,501 | $37,344 | $9,905 | $27,439 |
| 2023 | $7,155 | $35,233 | $8,720 | $26,513 |
| 2022 | $5,275 | $50,460 | $13,320 | $37,140 |
| 2021 | $7,063 | $48,420 | $13,320 | $35,100 |
| 2020 | $6,686 | $45,540 | $13,320 | $32,220 |
| 2019 | $6,217 | $45,180 | $13,320 | $31,860 |
| 2018 | $5,688 | $29,361 | $10,106 | $19,255 |
| 2017 | $5,686 | $29,361 | $10,668 | $18,693 |
| 2016 | $5,515 | $29,361 | $10,668 | $18,693 |
| 2015 | $2,654 | $27,489 | $10,969 | $16,520 |
| 2014 | $2,654 | $25,934 | $11,258 | $14,676 |
Source: Public Records
Map
Nearby Homes