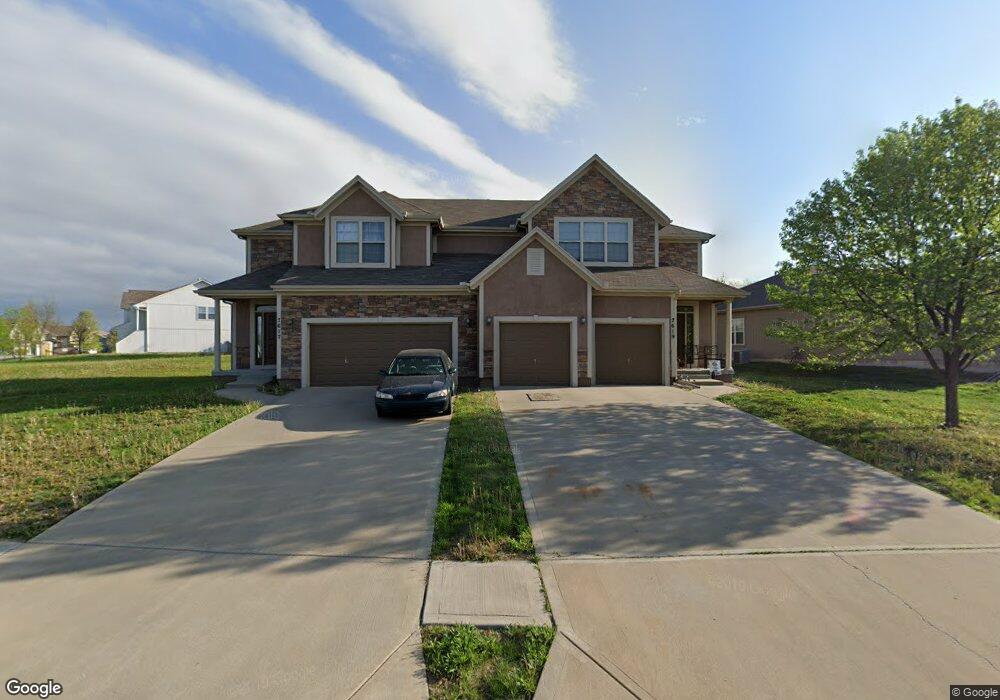
7617 Mccoy St Shawnee, KS 66227
Estimated Value: $467,000 - $680,694
6
Beds
6
Baths
3,570
Sq Ft
$148/Sq Ft
Est. Value
About This Home
This home is located at 7617 Mccoy St, Shawnee, KS 66227 and is currently estimated at $528,174, approximately $147 per square foot. 7617 Mccoy St is a home located in Johnson County with nearby schools including Horizon Elementary School, Mill Creek Middle School, and Mill Valley High School.
Ownership History
Date
Name
Owned For
Owner Type
Purchase Details
Closed on
Feb 3, 2010
Sold by
Bell Development Inc
Bought by
Saylor Properties Llc
Current Estimated Value
Home Financials for this Owner
Home Financials are based on the most recent Mortgage that was taken out on this home.
Original Mortgage
$665,889
Outstanding Balance
$443,563
Interest Rate
5.16%
Mortgage Type
Future Advance Clause Open End Mortgage
Estimated Equity
$84,611
Purchase Details
Closed on
Aug 20, 2007
Sold by
Williams Jerry and Williams Erica
Bought by
Dbh Development Inc
Purchase Details
Closed on
Nov 13, 2006
Sold by
Dbh Development Inc
Bought by
Williams Jerry and Williams Erica
Home Financials for this Owner
Home Financials are based on the most recent Mortgage that was taken out on this home.
Original Mortgage
$250,000
Interest Rate
6.28%
Mortgage Type
Future Advance Clause Open End Mortgage
Create a Home Valuation Report for This Property
The Home Valuation Report is an in-depth analysis detailing your home's value as well as a comparison with similar homes in the area
Home Values in the Area
Average Home Value in this Area
Purchase History
| Date | Buyer | Sale Price | Title Company |
|---|---|---|---|
| Saylor Properties Llc | -- | Homestead Title | |
| Dbh Development Inc | -- | Kansas Title | |
| Williams Jerry | -- | Kansas Title |
Source: Public Records
Mortgage History
| Date | Status | Borrower | Loan Amount |
|---|---|---|---|
| Open | Saylor Properties Llc | $665,889 | |
| Previous Owner | Williams Jerry | $250,000 |
Source: Public Records
Tax History Compared to Growth
Tax History
| Year | Tax Paid | Tax Assessment Tax Assessment Total Assessment is a certain percentage of the fair market value that is determined by local assessors to be the total taxable value of land and additions on the property. | Land | Improvement |
|---|---|---|---|---|
| 2024 | $5,859 | $49,738 | $8,034 | $41,704 |
| 2023 | $5,642 | $47,369 | $8,034 | $39,335 |
| 2022 | $5,644 | $46,414 | $6,419 | $39,995 |
| 2021 | $5,644 | $46,932 | $5,833 | $41,099 |
| 2020 | $5,646 | $44,275 | $5,833 | $38,442 |
| 2019 | $5,344 | $41,262 | $5,833 | $35,429 |
| 2018 | $5,279 | $40,388 | $5,833 | $34,555 |
| 2017 | $5,003 | $37,306 | $5,070 | $32,236 |
| 2016 | $4,841 | $35,638 | $5,070 | $30,568 |
| 2015 | $4,756 | $34,626 | $5,070 | $29,556 |
| 2013 | -- | $34,557 | $5,070 | $29,487 |
Source: Public Records
Map
Nearby Homes
- 22410 W 76th St
- 22408 W 76th St
- 22312 W 76th St
- 22310 W 76th St
- 00 75th St
- 000 75th St
- 0000 75th St
- 9309 Aminda St
- 7342 Mccoy St
- 22707 W 73rd St
- 0 Hedge Lane Terrace
- Cypress Plan at Bristol Highlands - The Manors
- Del Mar Front Entry Plan at Bristol Highlands - The Manors
- Del Mar Front Entry Plan at Bristol Highlands - The Estates
- Regency II Plan at Bristol Highlands - The Estates
- Aspen I Plan at Bristol Highlands - The Manors
- The Oakmont Plan at Bristol Highlands - The Estates
- 23136 W 71st Terrace
- 7914 Round Prairie St
- 7923 Round Prairie St
- 22422 W 76th St
- 22420 W 76th St
- 7537 Mccoy St
- 7535 Mccoy St
- 0 Mccoy St
- 7542 Mccoy St
- 7622 Mccoy St
- 7614 Mccoy St
- 7544 Mccoy St
- 22414 W 76th St
- 7531 Mccoy St
- 22409 W 76th St
- 22417 W 76th Terrace
- 22416 W 76th St
- 7529 Mccoy St
- 7608 Mccoy St
- 7602 Mccoy St
- 22504 W 76th Terrace
- 7610 Mccoy St
- 7604 Mccoy St