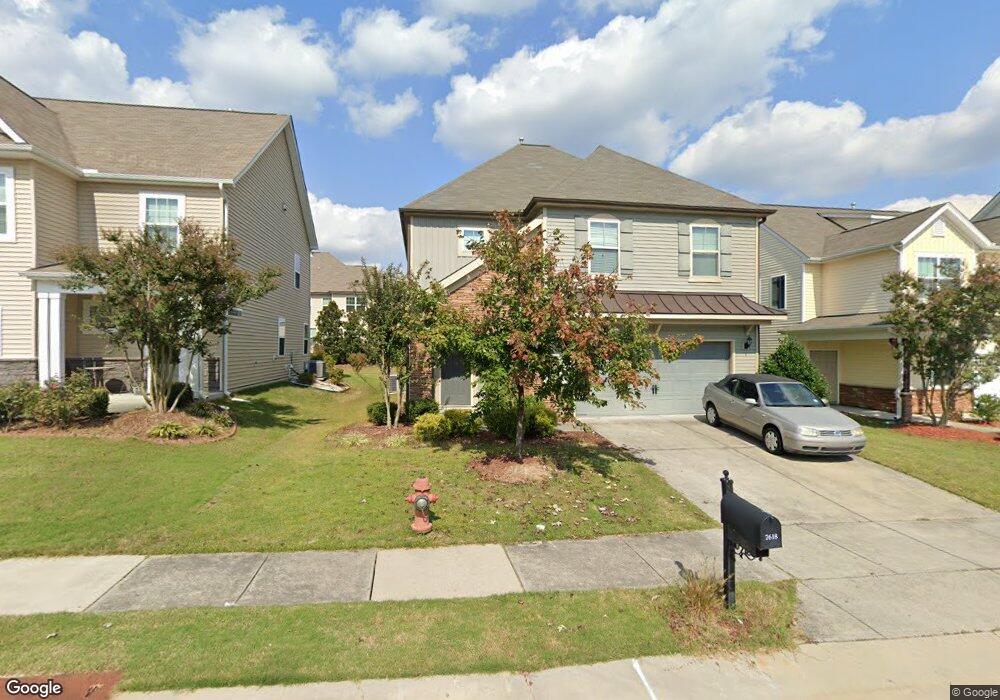
7618 Mapleshire Dr Unit Lt119 Raleigh, NC 27616
Northeast Raleigh NeighborhoodEstimated Value: $378,125 - $439,000
4
Beds
3
Baths
2,173
Sq Ft
$191/Sq Ft
Est. Value
About This Home
This home is located at 7618 Mapleshire Dr Unit Lt119, Raleigh, NC 27616 and is currently estimated at $415,781, approximately $191 per square foot. 7618 Mapleshire Dr Unit Lt119 is a home located in Wake County with nearby schools including Forestville Road Elementary School, Neuse River Middle School, and Knightdale High.
Ownership History
Date
Name
Owned For
Owner Type
Purchase Details
Closed on
Jan 19, 2024
Sold by
Wilson Amy A and Wilson Gregory L
Bought by
Bridges Gregory L and Wilson Amy A
Current Estimated Value
Home Financials for this Owner
Home Financials are based on the most recent Mortgage that was taken out on this home.
Original Mortgage
$210,000
Outstanding Balance
$206,184
Interest Rate
6.75%
Mortgage Type
New Conventional
Estimated Equity
$209,597
Purchase Details
Closed on
Feb 26, 2013
Sold by
D R Horton Inc
Bought by
Wilson Amy A and Bridges Amy A
Home Financials for this Owner
Home Financials are based on the most recent Mortgage that was taken out on this home.
Original Mortgage
$200,727
Interest Rate
4.25%
Mortgage Type
Adjustable Rate Mortgage/ARM
Purchase Details
Closed on
Feb 25, 2013
Sold by
D R Horton Inc
Bought by
Wilson Amy A and Bridges Amy A
Home Financials for this Owner
Home Financials are based on the most recent Mortgage that was taken out on this home.
Original Mortgage
$200,727
Interest Rate
4.25%
Mortgage Type
Adjustable Rate Mortgage/ARM
Create a Home Valuation Report for This Property
The Home Valuation Report is an in-depth analysis detailing your home's value as well as a comparison with similar homes in the area
Home Values in the Area
Average Home Value in this Area
Purchase History
| Date | Buyer | Sale Price | Title Company |
|---|---|---|---|
| Bridges Gregory L | -- | None Listed On Document | |
| Bridges Gregory L | -- | None Listed On Document | |
| Wilson Amy A | -- | None Available | |
| Wilson Amy A | -- | None Available |
Source: Public Records
Mortgage History
| Date | Status | Borrower | Loan Amount |
|---|---|---|---|
| Open | Bridges Gregory L | $210,000 | |
| Closed | Bridges Gregory L | $210,000 | |
| Previous Owner | Wilson Amy A | $200,727 | |
| Previous Owner | Wilson Amy A | $200,727 |
Source: Public Records
Tax History Compared to Growth
Tax History
| Year | Tax Paid | Tax Assessment Tax Assessment Total Assessment is a certain percentage of the fair market value that is determined by local assessors to be the total taxable value of land and additions on the property. | Land | Improvement |
|---|---|---|---|---|
| 2025 | $3,051 | $347,537 | $80,000 | $267,537 |
| 2024 | $3,038 | $347,537 | $80,000 | $267,537 |
| 2023 | $2,867 | $261,199 | $55,000 | $206,199 |
| 2022 | $2,665 | $261,199 | $55,000 | $206,199 |
| 2021 | $2,561 | $261,199 | $55,000 | $206,199 |
| 2020 | $2,515 | $261,199 | $55,000 | $206,199 |
| 2019 | $2,527 | $216,298 | $42,000 | $174,298 |
| 2018 | $2,383 | $216,298 | $42,000 | $174,298 |
| 2017 | $2,270 | $216,298 | $42,000 | $174,298 |
| 2016 | $2,224 | $216,298 | $42,000 | $174,298 |
| 2015 | $2,231 | $213,534 | $38,000 | $175,534 |
| 2014 | $2,116 | $213,534 | $38,000 | $175,534 |
Source: Public Records
Map
Nearby Homes
- 7725 Weathered Oak Way
- 7727 Weathered Oak Way
- 7661 Mapleshire Dr
- 7613 Oakberry Dr
- 7636 Birchmoor Way
- 7817 Elmshire Way
- 7454 Randshire Way
- 7576 Oakberry Dr
- 7536 Oakberry Dr
- 4004 Mount Moran Rd
- 3932 Mount Moran Rd
- 7316 Birchshire Dr
- LANSING - TRADITIONS Plan at Chapel Townes
- DENVER - TRADITIONS Plan at Chapel Townes
- CARSON - TRADITIONS Plan at Chapel Townes
- 7301 Vanover Dr
- 4208 Bluewing Rd
- 2205 Bufflehead Rd
- 2224 Bufflehead Rd
- 4112 Mcgrath Way
- 7622 Mapleshire Dr Unit Lt120
- 7622 Mapleshire Dr
- 7614 Mapleshire Dr Unit LT118
- 7626 Mapleshire Dr Unit LT121
- 7626 Mapleshire Dr
- 7610 Mapleshire Dr
- 7623 Weathered Oak Way Unit 140
- 7623 Weathered Oak Way
- 7625 Weathered Oak Way Unit 139
- 7625 Weathered Oak Way
- 7619 Weathered Oak Way Unit 141
- 7627 Weathered Oak Way Unit LT138
- 7627 Weathered Oak Way
- 7617 Weathered Oak Way Unit LT 142
- 7617 Weathered Oak Way
- 7629 Weathered Oak Way Unit 137
- 7629 Weathered Oak Way
- 7615 Weathered Oak Way Unit LT143
- 7615 Weathered Oak Way
- 7617 Mapleshire Dr