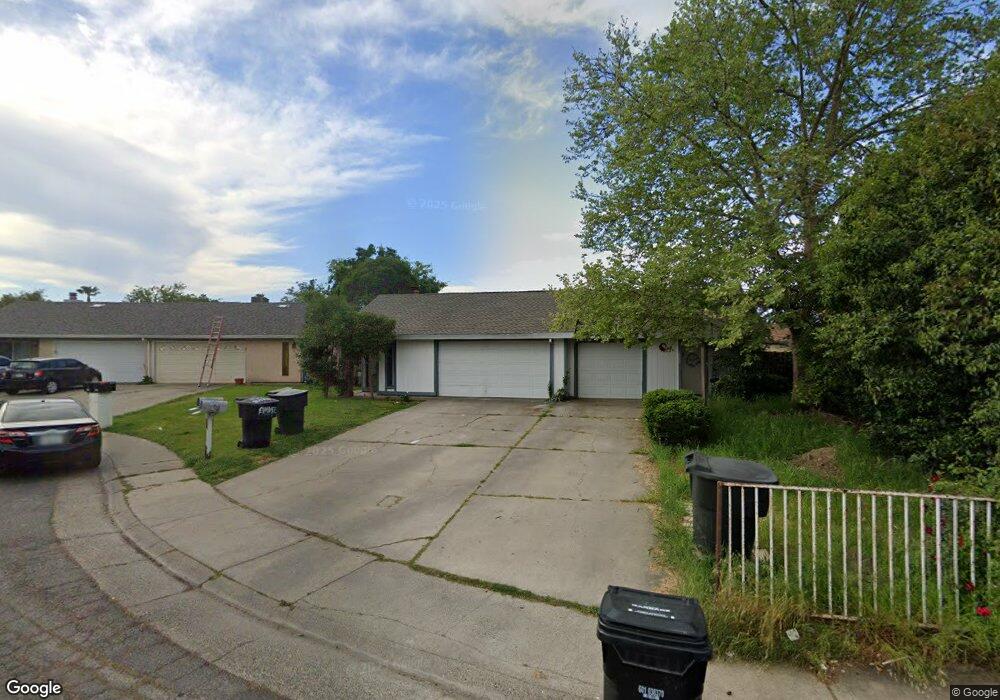
7620 Bogey Ct Sacramento, CA 95828
Estimated Value: $373,000 - $474,000
4
Beds
2
Baths
1,800
Sq Ft
$243/Sq Ft
Est. Value
About This Home
This home is located at 7620 Bogey Ct, Sacramento, CA 95828 and is currently estimated at $437,317, approximately $242 per square foot. 7620 Bogey Ct is a home located in Sacramento County with nearby schools including Anna Kirchgater Elementary School, James Rutter Middle School, and Florin High School.
Ownership History
Date
Name
Owned For
Owner Type
Purchase Details
Closed on
Oct 12, 2011
Sold by
Fannie Mae
Bought by
Su Vivian
Current Estimated Value
Purchase Details
Closed on
Aug 9, 2011
Sold by
Xiong Ia and Noukhay Xujengthay K
Bought by
Federal National Mortgage Association and Fannie Mae
Purchase Details
Closed on
Aug 8, 2001
Sold by
Colfescu Teofil Nicolale and Zamfir Daniel
Bought by
Noukhay Xujengthay K and Xiong Ia
Home Financials for this Owner
Home Financials are based on the most recent Mortgage that was taken out on this home.
Original Mortgage
$119,225
Interest Rate
7.1%
Purchase Details
Closed on
Nov 20, 1998
Sold by
Lidia Colfescu Corneliu and Lidia Daniel Zamfir
Bought by
Colfescu Teofil Nicolale and Zamfir Daniel
Create a Home Valuation Report for This Property
The Home Valuation Report is an in-depth analysis detailing your home's value as well as a comparison with similar homes in the area
Home Values in the Area
Average Home Value in this Area
Purchase History
| Date | Buyer | Sale Price | Title Company |
|---|---|---|---|
| Su Vivian | $99,500 | Old Republic Title Company | |
| Federal National Mortgage Association | $274,576 | Accommodation | |
| Noukhay Xujengthay K | $126,000 | Chicago Title Co | |
| Colfescu Teofil Nicolale | -- | -- |
Source: Public Records
Mortgage History
| Date | Status | Borrower | Loan Amount |
|---|---|---|---|
| Previous Owner | Noukhay Xujengthay K | $119,225 |
Source: Public Records
Tax History Compared to Growth
Tax History
| Year | Tax Paid | Tax Assessment Tax Assessment Total Assessment is a certain percentage of the fair market value that is determined by local assessors to be the total taxable value of land and additions on the property. | Land | Improvement |
|---|---|---|---|---|
| 2025 | $1,392 | $124,589 | $36,421 | $88,168 |
| 2024 | $1,392 | $122,147 | $35,707 | $86,440 |
| 2023 | $1,358 | $119,753 | $35,007 | $84,746 |
| 2022 | $1,336 | $117,406 | $34,321 | $83,085 |
| 2021 | $1,321 | $115,105 | $33,649 | $81,456 |
| 2020 | $1,304 | $113,925 | $33,304 | $80,621 |
| 2019 | $1,281 | $111,692 | $32,651 | $79,041 |
| 2018 | $1,248 | $109,503 | $32,011 | $77,492 |
| 2017 | $1,227 | $107,357 | $31,384 | $75,973 |
| 2016 | $1,167 | $105,253 | $30,769 | $74,484 |
| 2015 | $1,146 | $103,673 | $30,307 | $73,366 |
| 2014 | $1,127 | $101,643 | $29,714 | $71,929 |
Source: Public Records
Map
Nearby Homes
- 7625 Par Pkwy
- 7407 Sunborough Ln
- 7313 Sunsilver Ln
- 7605 Mctavish Cir
- 7309 Sunleaf Ln
- 7724 La Bandera Way
- 7313 Sunshire Ln
- 7633 Clement Cir
- 7413 Sunny Meadows Ln
- 8013 Skywoods Way
- 7206 Willowwest Ct
- 7451 Albezzia Ln
- 7551 Red Bud Ln
- 7212 Kallie Kay Ln
- 7566 Sunmore Ln
- 7548 Huckleberry Ln
- 7618 Sunvaught Ln
- 7422 Sun Point Ln
- 7100 Sunbridge Ln
- 7467 Power Inn Rd
- 7616 Bogey Ct
- 7624 Bogey Ct
- 7660 Jacaranda Ct
- 7661 Lisa Ann Ct
- 7612 Bogey Ct
- 7628 Bogey Ct
- 7661 Jacaranda Ct
- 7621 Bogey Ct
- 7619 Eagle Park Dr
- 7617 Bogey Ct
- 7625 Eagle Park Dr
- 7608 Bogey Ct
- 7613 Eagle Park Dr
- 7629 Bogey Ct
- 7665 Jacaranda Ct
- 7625 Bogey Ct
- 7663 Jacaranda Ct
- 7662 Lisa Ann Ct
- 7613 Bogey Ct
- 7650 Clover Woods Ct