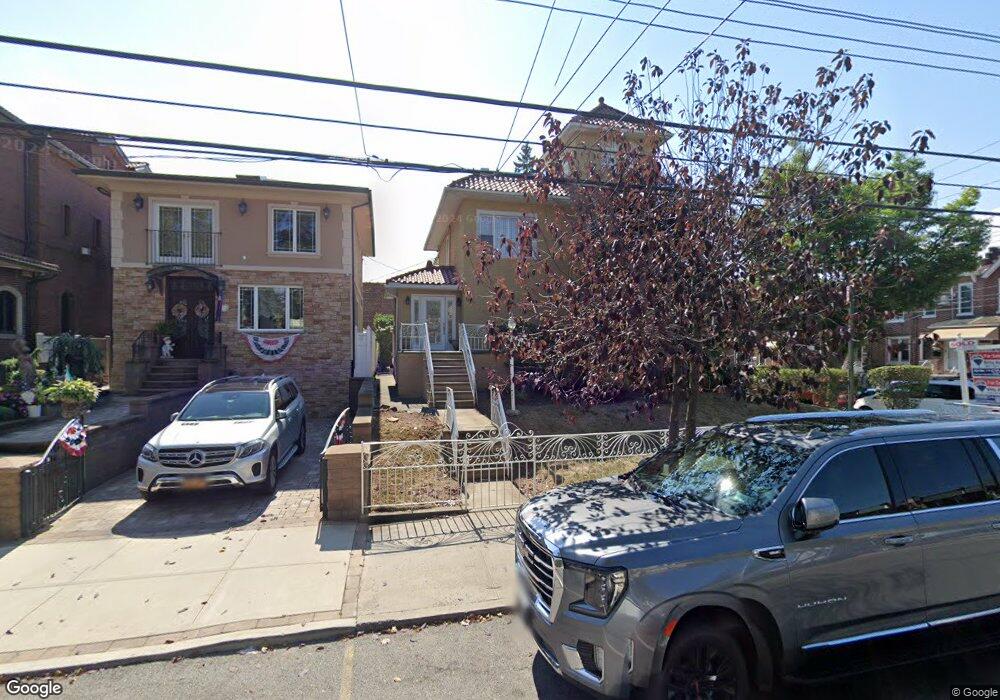
7621 12 Ave Brooklyn, NY 11228
Dyker Heights NeighborhoodEstimated Value: $1,411,000 - $1,718,980
3
Beds
3
Baths
2,990
Sq Ft
$516/Sq Ft
Est. Value
About This Home
This home is located at 7621 12 Ave, Brooklyn, NY 11228 and is currently estimated at $1,544,245, approximately $516 per square foot. 7621 12 Ave is a home located in Kings County with nearby schools including P.S. 176 Ovington, IS 201 Madeleine Brennan Intermediate School, and New Utrecht High School.
Ownership History
Date
Name
Owned For
Owner Type
Purchase Details
Closed on
Feb 13, 2024
Sold by
Angelo Vito
Bought by
7621 12Th Ave Llc
Current Estimated Value
Purchase Details
Closed on
Aug 11, 2022
Sold by
Miccio Anthony S
Bought by
Angelo Vito
Home Financials for this Owner
Home Financials are based on the most recent Mortgage that was taken out on this home.
Original Mortgage
$975,000
Interest Rate
5.3%
Mortgage Type
Purchase Money Mortgage
Purchase Details
Closed on
Aug 26, 2010
Sold by
Miccio Anthony S and Miccio Linda
Bought by
Miccio Anthony S
Home Financials for this Owner
Home Financials are based on the most recent Mortgage that was taken out on this home.
Original Mortgage
$938,250
Interest Rate
4.48%
Mortgage Type
Purchase Money Mortgage
Create a Home Valuation Report for This Property
The Home Valuation Report is an in-depth analysis detailing your home's value as well as a comparison with similar homes in the area
Home Values in the Area
Average Home Value in this Area
Purchase History
| Date | Buyer | Sale Price | Title Company |
|---|---|---|---|
| 7621 12Th Ave Llc | -- | -- | |
| Angelo Vito | $1,600,000 | -- | |
| Angelo Vito | $1,600,000 | -- | |
| Miccio Anthony S | -- | -- | |
| Miccio Anthony S | -- | -- |
Source: Public Records
Mortgage History
| Date | Status | Borrower | Loan Amount |
|---|---|---|---|
| Previous Owner | Angelo Vito | $975,000 | |
| Previous Owner | Miccio Anthony S | $938,250 |
Source: Public Records
Tax History Compared to Growth
Tax History
| Year | Tax Paid | Tax Assessment Tax Assessment Total Assessment is a certain percentage of the fair market value that is determined by local assessors to be the total taxable value of land and additions on the property. | Land | Improvement |
|---|---|---|---|---|
| 2025 | $14,018 | $93,660 | $32,460 | $61,200 |
| 2024 | $14,018 | $89,520 | $32,460 | $57,060 |
| 2023 | $11,892 | $78,720 | $32,460 | $46,260 |
| 2022 | $11,028 | $80,520 | $32,460 | $48,060 |
| 2021 | $10,968 | $77,100 | $32,460 | $44,640 |
| 2020 | $5,144 | $83,760 | $32,460 | $51,300 |
| 2019 | $10,285 | $83,760 | $32,460 | $51,300 |
| 2018 | $9,947 | $48,795 | $21,410 | $27,385 |
| 2017 | $9,384 | $46,034 | $20,754 | $25,280 |
| 2016 | $8,682 | $43,430 | $26,311 | $17,119 |
| 2015 | $5,018 | $40,972 | $24,974 | $15,998 |
| 2014 | $5,018 | $40,972 | $24,189 | $16,783 |
Source: Public Records
Map
Nearby Homes