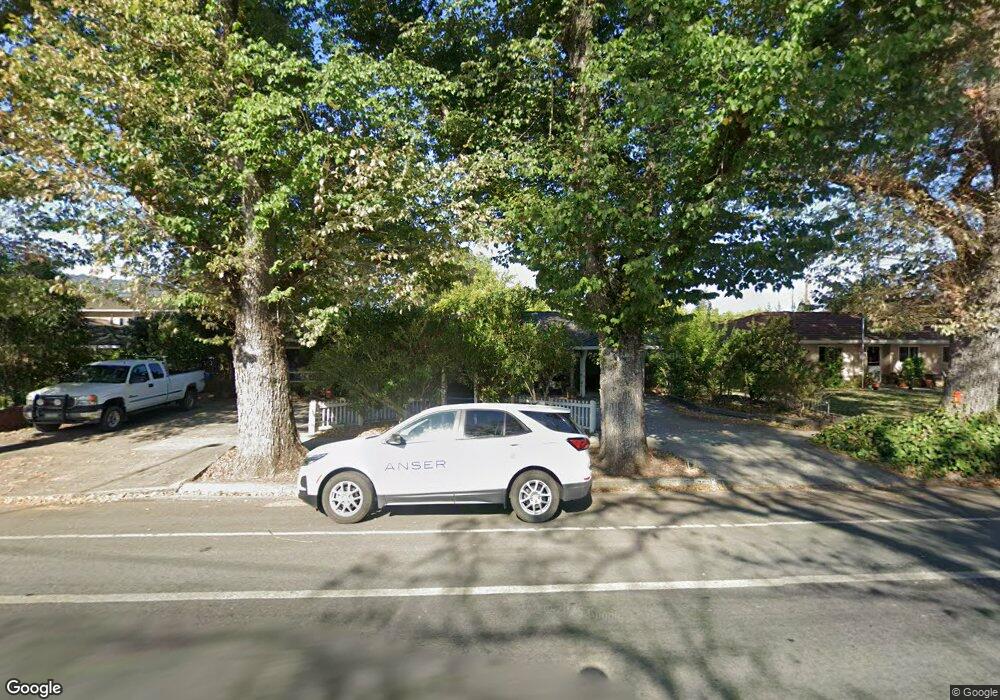
7621 Miller Ave Gilroy, CA 95020
Estimated Value: $794,158 - $1,104,000
3
Beds
3
Baths
1,833
Sq Ft
$517/Sq Ft
Est. Value
About This Home
This home is located at 7621 Miller Ave, Gilroy, CA 95020 and is currently estimated at $948,040, approximately $517 per square foot. 7621 Miller Ave is a home located in Santa Clara County with nearby schools including El Roble Elementary School, Brownell Middle School, and Solorsano Middle School.
Ownership History
Date
Name
Owned For
Owner Type
Purchase Details
Closed on
Mar 27, 2023
Sold by
Donald F Manzo Surviving Spouses Trust
Bought by
Manzo Donald
Current Estimated Value
Home Financials for this Owner
Home Financials are based on the most recent Mortgage that was taken out on this home.
Original Mortgage
$461,250
Outstanding Balance
$447,760
Interest Rate
6.32%
Mortgage Type
New Conventional
Estimated Equity
$500,280
Purchase Details
Closed on
Jun 26, 2008
Sold by
Manzo Donald F
Bought by
Manzo Donald F
Purchase Details
Closed on
Apr 14, 1994
Sold by
Manzo Donald and Manzo Rhoda
Bought by
Manzo Donald F and Manzo Rhoda E
Home Financials for this Owner
Home Financials are based on the most recent Mortgage that was taken out on this home.
Original Mortgage
$164,000
Interest Rate
7.67%
Create a Home Valuation Report for This Property
The Home Valuation Report is an in-depth analysis detailing your home's value as well as a comparison with similar homes in the area
Home Values in the Area
Average Home Value in this Area
Purchase History
| Date | Buyer | Sale Price | Title Company |
|---|---|---|---|
| Manzo Donald | $641,500 | Old Republic Title | |
| Manzo Donald F | -- | None Available | |
| Manzo Donald F | -- | -- | |
| Manzo Donald | -- | Chicago Title Company |
Source: Public Records
Mortgage History
| Date | Status | Borrower | Loan Amount |
|---|---|---|---|
| Open | Manzo Donald | $461,250 | |
| Previous Owner | Manzo Donald | $164,000 |
Source: Public Records
Tax History
| Year | Tax Paid | Tax Assessment Tax Assessment Total Assessment is a certain percentage of the fair market value that is determined by local assessors to be the total taxable value of land and additions on the property. | Land | Improvement |
|---|---|---|---|---|
| 2025 | $8,543 | $707,803 | $379,444 | $328,359 |
| 2024 | $8,543 | $693,925 | $372,004 | $321,921 |
| 2023 | $1,058 | $81,282 | $18,843 | $62,439 |
| 2022 | $1,038 | $79,689 | $18,474 | $61,215 |
| 2021 | $1,029 | $78,127 | $18,112 | $60,015 |
| 2020 | $1,016 | $77,327 | $17,927 | $59,400 |
| 2019 | $1,006 | $75,812 | $17,576 | $58,236 |
| 2018 | $943 | $74,327 | $17,232 | $57,095 |
| 2017 | $957 | $72,871 | $16,895 | $55,976 |
| 2016 | $926 | $71,443 | $16,564 | $54,879 |
| 2015 | $876 | $70,371 | $16,316 | $54,055 |
| 2014 | $868 | $68,994 | $15,997 | $52,997 |
Source: Public Records
Map
Nearby Homes
- 60 Monte Vista Way
- 7490 Santa Theresa Dr Unit 10
- 7460 Miller Ave
- 925 Blake Ct
- 700 Eschenburg Dr
- 7821 Santa Theresa Dr
- 7384 Ailes Ct
- 7376 Ailes Ct
- 7360 Ailes Ct
- 704 Tennyson Dr
- 7305 Orchard Dr
- 7351 Princevalle St Unit Homesite 18
- 7681 Hanna St
- 7609 Santa Paula Dr
- 7630 Hanna St
- 6389 Tawhana Ln
- 7310 Carmel St
- 622 Broadway
- 620 Broadway
- 626 Broadway
Your Personal Tour Guide
Ask me questions while you tour the home.