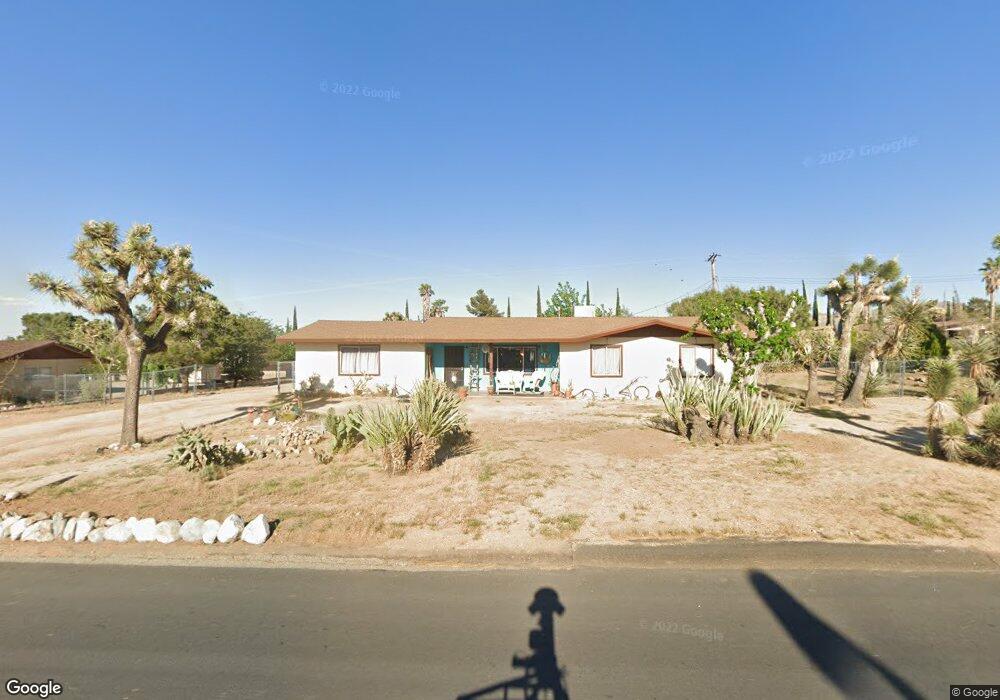
7623 Frontera Ave Yucca Valley, CA 92284
Estimated Value: $296,928 - $357,000
3
Beds
2
Baths
1,250
Sq Ft
$265/Sq Ft
Est. Value
About This Home
This home is located at 7623 Frontera Ave, Yucca Valley, CA 92284 and is currently estimated at $331,482, approximately $265 per square foot. 7623 Frontera Ave is a home located in San Bernardino County with nearby schools including Onaga Elementary School, La Contenta Middle School, and Yucca Valley High School.
Ownership History
Date
Name
Owned For
Owner Type
Purchase Details
Closed on
Jun 5, 2025
Sold by
Szabol Susan R
Bought by
Susan R Szabol Revocable Living Trust
Current Estimated Value
Purchase Details
Closed on
Oct 11, 2021
Sold by
Szabol Susan R
Bought by
Szabol Susan R and Davis Kathleen Dawn
Purchase Details
Closed on
Feb 13, 2003
Sold by
Szabol Susan
Bought by
Szabol Susan R
Home Financials for this Owner
Home Financials are based on the most recent Mortgage that was taken out on this home.
Original Mortgage
$70,400
Interest Rate
5.76%
Purchase Details
Closed on
May 8, 2000
Sold by
Mccullough Susan R
Bought by
Szabol Susan
Home Financials for this Owner
Home Financials are based on the most recent Mortgage that was taken out on this home.
Original Mortgage
$63,000
Interest Rate
8.67%
Create a Home Valuation Report for This Property
The Home Valuation Report is an in-depth analysis detailing your home's value as well as a comparison with similar homes in the area
Home Values in the Area
Average Home Value in this Area
Purchase History
| Date | Buyer | Sale Price | Title Company |
|---|---|---|---|
| Susan R Szabol Revocable Living Trust | -- | None Listed On Document | |
| Szabol Susan R | -- | None Listed On Document | |
| Szabol Susan R | -- | Fidelity National Title | |
| Szabol Susan | -- | Fidelity National Title Co |
Source: Public Records
Mortgage History
| Date | Status | Borrower | Loan Amount |
|---|---|---|---|
| Previous Owner | Szabol Susan R | $157,000 | |
| Previous Owner | Szabol Susan R | $140,000 | |
| Previous Owner | Szabol Susan R | $118,000 | |
| Previous Owner | Szabol Susan R | $70,400 | |
| Previous Owner | Szabol Susan | $63,000 |
Source: Public Records
Tax History Compared to Growth
Tax History
| Year | Tax Paid | Tax Assessment Tax Assessment Total Assessment is a certain percentage of the fair market value that is determined by local assessors to be the total taxable value of land and additions on the property. | Land | Improvement |
|---|---|---|---|---|
| 2025 | $2,355 | $77,337 | $12,420 | $64,917 |
| 2024 | $2,355 | $75,820 | $12,176 | $63,644 |
| 2023 | $2,136 | $74,333 | $11,937 | $62,396 |
| 2022 | $2,050 | $72,876 | $11,703 | $61,173 |
| 2021 | $2,154 | $71,448 | $11,474 | $59,974 |
| 2020 | $2,162 | $70,715 | $11,356 | $59,359 |
| 2019 | $1,429 | $69,328 | $11,133 | $58,195 |
| 2018 | $1,125 | $67,969 | $10,915 | $57,054 |
| 2017 | $759 | $66,636 | $10,701 | $55,935 |
| 2016 | $744 | $65,329 | $10,491 | $54,838 |
| 2015 | $726 | $64,347 | $10,333 | $54,014 |
| 2014 | $719 | $63,087 | $10,131 | $52,956 |
Source: Public Records
Map
Nearby Homes
- 7728 Balsa Ave
- 7495 Balsa Ave
- 7504 Balsa Ave
- 7592 Hanford Ave
- 5280 Hilton Ave
- 7625 Hilton Ave
- 7475 Alaba Ave
- 9272 Emerson Ave
- 0 Emerson Ave Unit PW25218189
- 0 Emerson Ave Unit OC25111587
- 2333 Bonita Trail
- 0 Navajo Trail Unit 219133849DA
- 57910 Joshua Dr
- 8776 Warren Vista Ave
- 8804 Warren Vista Ave
- 7220 Hanford Ave
- 7457 Lucerne Vista Ave
- 7744 Victor Vista
- 57565 Pueblo Trail Unit 2
- 7442 Camarilla Ave
- 7599 Frontera Ave
- 7643 Frontera Ave
- 7622 Balsa Ave
- 7608 Balsa Ave
- 7638 Balsa Ave
- 7622 Frontera Ave
- 7642 Frontera Ave
- 7600 Frontera Ave
- 7592 Balsa Ave
- 7654 Balsa Ave
- 7665 Frontera Ave
- 7579 Frontera Ave
- 7623 Alaba Ave
- 7576 Balsa Ave
- 7664 Frontera Ave
- 7578 Frontera Ave
- 7670 Balsa Ave
- 7599 Alaba Ave
- 7643 Alaba Ave
- 7609 Balsa Ave