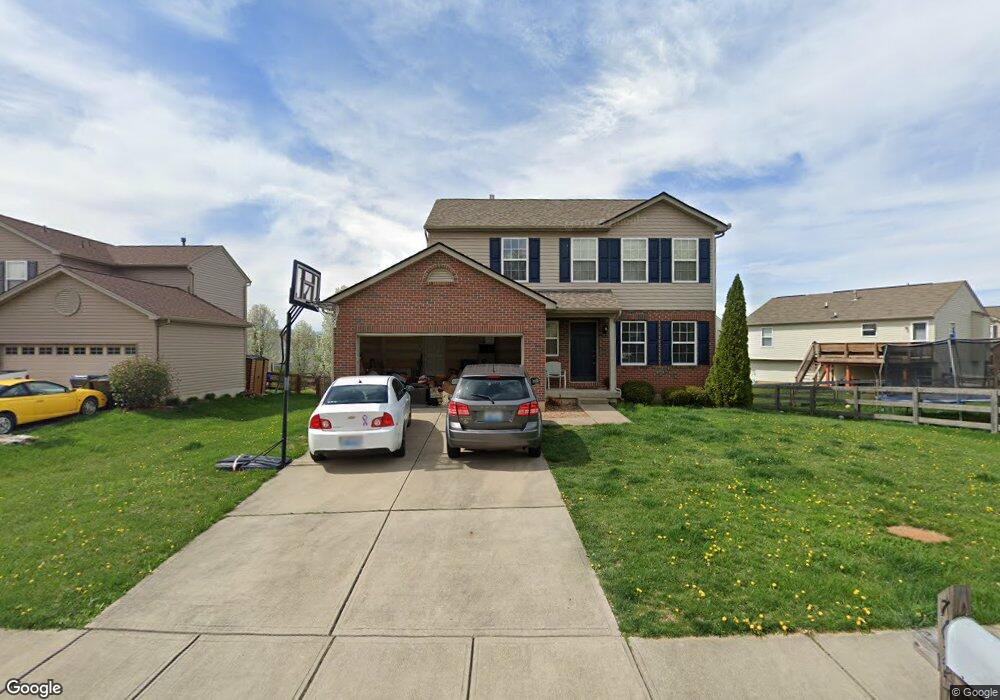
7625 Falls Creek Way Burlington, KY 41005
Estimated Value: $328,935 - $348,000
3
Beds
3
Baths
1,704
Sq Ft
$197/Sq Ft
Est. Value
About This Home
This home is located at 7625 Falls Creek Way, Burlington, KY 41005 and is currently estimated at $336,484, approximately $197 per square foot. 7625 Falls Creek Way is a home located in Boone County with nearby schools including Longbranch Elementary School, Ballyshannon Middle School, and Randall K. Cooper High School.
Ownership History
Date
Name
Owned For
Owner Type
Purchase Details
Closed on
Mar 13, 2015
Sold by
Costello Brian and Costello Sara
Bought by
Wilson David B and Wilson Vicki Lynn
Current Estimated Value
Home Financials for this Owner
Home Financials are based on the most recent Mortgage that was taken out on this home.
Original Mortgage
$174,489
Outstanding Balance
$133,690
Interest Rate
3.69%
Mortgage Type
New Conventional
Estimated Equity
$202,794
Purchase Details
Closed on
Aug 26, 2010
Sold by
Costello Brian and Costello Sara
Bought by
Costello Brian and Costello Sara
Purchase Details
Closed on
Nov 22, 2004
Sold by
Ryland Group Inc
Bought by
Costello Brian and Schornick Sara
Home Financials for this Owner
Home Financials are based on the most recent Mortgage that was taken out on this home.
Original Mortgage
$165,300
Interest Rate
5.57%
Mortgage Type
Future Advance Clause Open End Mortgage
Create a Home Valuation Report for This Property
The Home Valuation Report is an in-depth analysis detailing your home's value as well as a comparison with similar homes in the area
Home Values in the Area
Average Home Value in this Area
Purchase History
| Date | Buyer | Sale Price | Title Company |
|---|---|---|---|
| Wilson David B | $171,000 | None Available | |
| Costello Brian | -- | New Millennium Title Group | |
| Costello Brian | $174,012 | Ryland Title Company |
Source: Public Records
Mortgage History
| Date | Status | Borrower | Loan Amount |
|---|---|---|---|
| Open | Wilson David B | $174,489 | |
| Previous Owner | Costello Brian | $165,300 |
Source: Public Records
Tax History Compared to Growth
Tax History
| Year | Tax Paid | Tax Assessment Tax Assessment Total Assessment is a certain percentage of the fair market value that is determined by local assessors to be the total taxable value of land and additions on the property. | Land | Improvement |
|---|---|---|---|---|
| 2024 | $2,506 | $226,500 | $35,000 | $191,500 |
| 2023 | $2,521 | $226,500 | $35,000 | $191,500 |
| 2022 | $2,025 | $181,200 | $35,000 | $146,200 |
| 2021 | $2,104 | $181,200 | $35,000 | $146,200 |
| 2020 | $2,065 | $181,200 | $35,000 | $146,200 |
| 2019 | $1,964 | $171,000 | $28,000 | $143,000 |
| 2018 | $2,009 | $171,000 | $28,000 | $143,000 |
| 2017 | $1,946 | $171,000 | $28,000 | $143,000 |
| 2015 | $1,815 | $160,610 | $33,000 | $127,610 |
| 2013 | -- | $174,010 | $28,000 | $146,010 |
Source: Public Records
Map
Nearby Homes
- 7704 Falls Creek Way
- 7536 Plum Creek Way
- 5894 Stillwater Ln
- 5890 Stillwater Ln
- 3033 Wolf Creek Way
- 3008 Ashbrook Cir
- 8629 Treeline Dr
- 5852 Stillwater Ln
- 7375 Sterling Springs Way
- 7400 Indian Ridge Way
- 5837 Stillwater Ln
- VANDERBURGH Plan at Stillwater
- BUCHANAN Plan at Stillwater
- SHELBURN Plan at Stillwater
- HIALEAH Plan at Stillwater
- ALDEN Plan at Stillwater
- VALE Plan at Stillwater
- QUENTIN Plan at Stillwater
- BEACHWOOD Plan at Stillwater
- 2960 Timber Ridge Way
- 7629 Falls Creek Way
- 7721 Falls Creek Way
- 7721 Falls Creek Way Unit 408
- 416 Falls Creek Way
- 7717 Falls Creek Way
- 7717 Falls Creek Way Unit 409
- 7725 Falls Creek Way
- 7633 Falls Creek Way
- 7709 Falls Creek Way
- 7709 Falls Creek Way Unit 410
- 7693 Falls Creek Way
- 7693 Falls Creek Way Unit 411
- 7624 Falls Creek Way
- 7624 Falls Creek Way Unit 400
- 7620 Falls Creek Way
- 7637 Falls Creek Way
- 7689 Falls Creek Way
- 7689 Falls Creek Way Unit 412
- 7616 Falls Creek Way
- 7628 Falls Creek Way