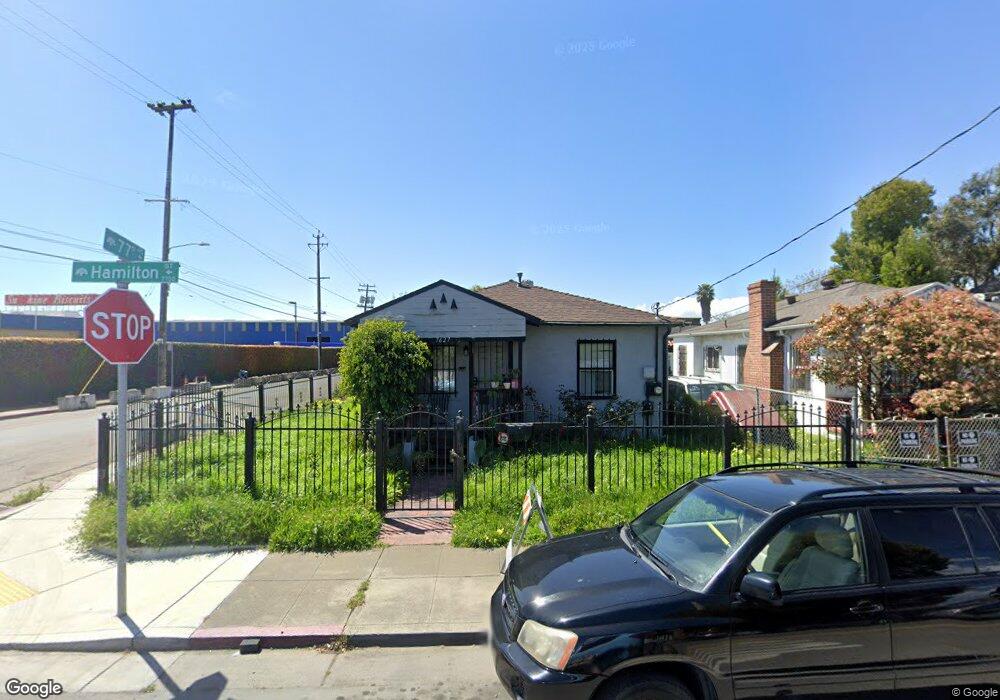
7627 Hamilton St Oakland, CA 94621
Fitchburg NeighborhoodEstimated Value: $319,000 - $461,000
2
Beds
1
Bath
683
Sq Ft
$568/Sq Ft
Est. Value
About This Home
This home is located at 7627 Hamilton St, Oakland, CA 94621 and is currently estimated at $387,632, approximately $567 per square foot. 7627 Hamilton St is a home located in Alameda County with nearby schools including Greenleaf Elementary School, Coliseum College Prep Academy, and Madison Park Academy (6-12).
Ownership History
Date
Name
Owned For
Owner Type
Purchase Details
Closed on
Sep 24, 2008
Sold by
U S Bank National Association
Bought by
Norflis Michael J and Varela Irene
Current Estimated Value
Purchase Details
Closed on
Jun 13, 2008
Sold by
Freeney Bernest C
Bought by
U S Bank National Assn and Structured Asset Securities Corp Structu
Purchase Details
Closed on
Aug 2, 2001
Sold by
Ascend Residential Properties Inc
Bought by
Freenay Bernest C
Home Financials for this Owner
Home Financials are based on the most recent Mortgage that was taken out on this home.
Original Mortgage
$151,200
Interest Rate
7.37%
Purchase Details
Closed on
Dec 6, 2000
Sold by
Mack Geraldine
Bought by
Ascend Residential Properties Inc
Purchase Details
Closed on
Oct 19, 2000
Sold by
Mack Raymond E
Bought by
Mack Geraldine
Create a Home Valuation Report for This Property
The Home Valuation Report is an in-depth analysis detailing your home's value as well as a comparison with similar homes in the area
Home Values in the Area
Average Home Value in this Area
Purchase History
| Date | Buyer | Sale Price | Title Company |
|---|---|---|---|
| Norflis Michael J | $75,000 | Chicago Title Company | |
| U S Bank National Assn | $157,027 | None Available | |
| Freenay Bernest C | $189,000 | American Title Co | |
| Ascend Residential Properties Inc | $90,000 | Fidelity National Title Co | |
| Mack Geraldine | -- | Financial Title Company | |
| Mack Geraldine | $76,000 | Financial Title Company |
Source: Public Records
Mortgage History
| Date | Status | Borrower | Loan Amount |
|---|---|---|---|
| Previous Owner | Freenay Bernest C | $151,200 | |
| Closed | Freenay Bernest C | $37,800 |
Source: Public Records
Tax History
| Year | Tax Paid | Tax Assessment Tax Assessment Total Assessment is a certain percentage of the fair market value that is determined by local assessors to be the total taxable value of land and additions on the property. | Land | Improvement |
|---|---|---|---|---|
| 2025 | $2,954 | $89,574 | $28,972 | $67,602 |
| 2024 | $2,954 | $87,681 | $28,404 | $66,277 |
| 2023 | $2,975 | $92,825 | $27,847 | $64,978 |
| 2022 | $2,824 | $84,005 | $27,301 | $63,704 |
| 2021 | $2,546 | $82,221 | $26,766 | $62,455 |
| 2020 | $2,515 | $88,307 | $26,492 | $61,815 |
| 2019 | $2,322 | $86,576 | $25,973 | $60,603 |
| 2018 | $2,276 | $84,878 | $25,463 | $59,415 |
| 2017 | $2,152 | $83,214 | $24,964 | $58,250 |
| 2016 | $1,988 | $81,583 | $24,475 | $57,108 |
| 2015 | $1,972 | $80,358 | $24,107 | $56,251 |
| 2014 | $1,878 | $78,785 | $23,635 | $55,150 |
Source: Public Records
Map
Nearby Homes
- 7621 Hamilton St
- 7619 Hamilton St
- 1077 77th Ave
- 7609 Hamilton St
- 7624 Hamilton St
- 7616 Hamilton St
- 7603 Hamilton St
- 1100 76th Ave
- 1066 76th Ave
- 1066 76th Ave
- 1062 76th Ave
- 1106 76th Ave
- 1119 77th Ave
- 1060 76th Ave
- 7529 Hamilton St
- 1054 76th Ave
- 1127 77th Ave
- 1101 76th Ave
- 1073 76th Ave
- 1100 77th Ave
Your Personal Tour Guide
Ask me questions while you tour the home.