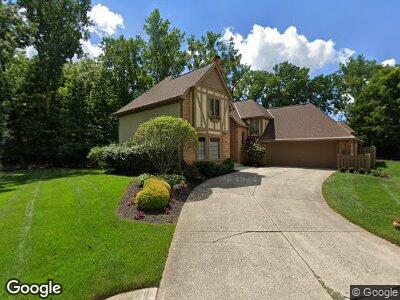
7627 Innbrook Place Columbus, OH 43235
Estimated Value: $753,000 - $885,000
5
Beds
3
Baths
3,450
Sq Ft
$234/Sq Ft
Est. Value
About This Home
This home is located at 7627 Innbrook Place, Columbus, OH 43235 and is currently estimated at $808,292, approximately $234 per square foot. 7627 Innbrook Place is a home located in Franklin County with nearby schools including Worthington Hills Elementary School, McCord Middle School, and Worthington Kilbourne High School.
Ownership History
Date
Name
Owned For
Owner Type
Purchase Details
Closed on
Oct 12, 2023
Sold by
Suffron Benjamin F
Bought by
Suffron Krista L
Current Estimated Value
Purchase Details
Closed on
May 9, 2005
Sold by
Suffron Krista L
Bought by
Suffron Benjamin F and Suffron Krista L
Home Financials for this Owner
Home Financials are based on the most recent Mortgage that was taken out on this home.
Original Mortgage
$308,000
Interest Rate
6.13%
Mortgage Type
New Conventional
Purchase Details
Closed on
Nov 13, 1989
Bought by
Suffron Krista L
Purchase Details
Closed on
Jan 19, 1988
Purchase Details
Closed on
Sep 1, 1980
Create a Home Valuation Report for This Property
The Home Valuation Report is an in-depth analysis detailing your home's value as well as a comparison with similar homes in the area
Home Values in the Area
Average Home Value in this Area
Purchase History
| Date | Buyer | Sale Price | Title Company |
|---|---|---|---|
| Suffron Krista L | -- | None Listed On Document | |
| Suffron Benjamin F | -- | Family Fir | |
| Suffron Krista L | $204,500 | -- | |
| -- | $225,000 | -- | |
| -- | $169,000 | -- |
Source: Public Records
Mortgage History
| Date | Status | Borrower | Loan Amount |
|---|---|---|---|
| Previous Owner | Suffron Benjamin F | $40,000 | |
| Previous Owner | Suffron Benjamin F | $328,600 | |
| Previous Owner | Suffron Benjamin F | $347,000 | |
| Previous Owner | Suffron Benjamin F | $347,221 | |
| Previous Owner | Suffron Benjamin F | $308,000 | |
| Previous Owner | Suffron Benjamin F | $138,029 | |
| Closed | Suffron Benjamin F | $77,000 |
Source: Public Records
Tax History Compared to Growth
Tax History
| Year | Tax Paid | Tax Assessment Tax Assessment Total Assessment is a certain percentage of the fair market value that is determined by local assessors to be the total taxable value of land and additions on the property. | Land | Improvement |
|---|---|---|---|---|
| 2024 | $15,957 | $259,910 | $53,900 | $206,010 |
| 2023 | $15,259 | $259,910 | $53,900 | $206,010 |
| 2022 | $13,135 | $177,520 | $37,800 | $139,720 |
| 2021 | $12,118 | $177,520 | $37,800 | $139,720 |
| 2020 | $11,672 | $177,520 | $37,800 | $139,720 |
| 2019 | $10,714 | $147,040 | $31,500 | $115,540 |
| 2018 | $9,702 | $147,040 | $31,500 | $115,540 |
| 2017 | $9,312 | $147,040 | $31,500 | $115,540 |
| 2016 | $9,023 | $127,090 | $22,470 | $104,620 |
| 2015 | $9,025 | $127,090 | $22,470 | $104,620 |
| 2014 | $9,021 | $127,090 | $22,470 | $104,620 |
| 2013 | $4,241 | $120,085 | $20,440 | $99,645 |
Source: Public Records
Map
Nearby Homes
- 1711 Twin Oaks Dr
- 1068 Rutherglen Dr
- 7847 Maplecreek Ct
- 1539 Clubview Blvd S
- 1018 Rutherglen Dr
- 7731 Sefton Park Dr
- 1192 Tessier Dr
- 1042 Circle On the Green
- 7914 Verandah Ct Unit 61
- 1824 Lost Valley Rd
- 8240 Longhorn Rd
- 1922 Laramie Dr Unit 24
- 1133 Blind Brook Dr
- 1336 Hickory Ridge Ln
- 1952 Laramie Dr Unit 14
- 825 Bluffview Dr
- 1546 Oakview Dr
- 7567 Simmswood Ct
- 1902 Slaton Ct
- 1721 Worthington Run Dr Unit 1721-1731
- 7627 Innbrook Place
- 7631 Innbrook Place
- 7624 Innbrook Place
- 1341 Briarmeadow Dr
- 7640 Innbrook Place
- 1357 Briarmeadow Dr
- 7650 Innbrook Place
- 1369 Briarmeadow Dr
- 7639 Oakhurst Ln
- 1346 Briarmeadow Dr
- 1360 Briarmeadow Dr
- 7625 Oakhurst Ln
- 1334 Briarmeadow Dr
- 7653 Oakhurst Ln
- 1385 Briarmeadow Dr
- 1318 Briarmeadow Dr
- 7651 Middlebrook Ln
- 1296 Briarmeadow Dr
- 7676 Middlebrook Ln
- 1399 Briarmeadow Dr