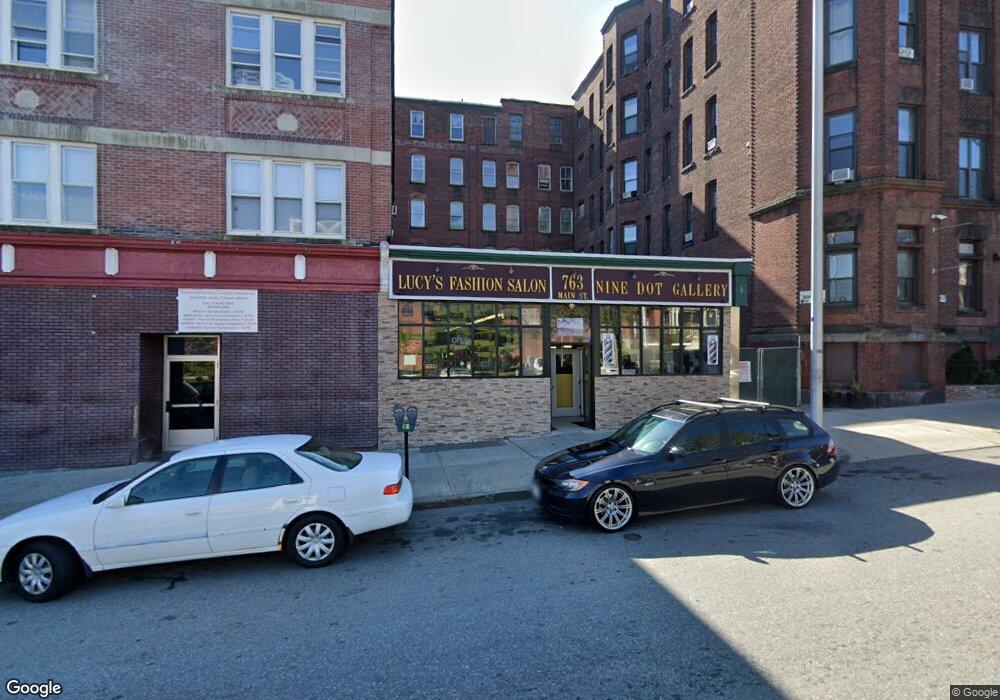
763 Main St Worcester, MA 01610
Beacon Brightly NeighborhoodEstimated Value: $367,706
Studio
--
Bath
1,800
Sq Ft
$204/Sq Ft
Est. Value
About This Home
This home is located at 763 Main St, Worcester, MA 01610 and is currently estimated at $367,706, approximately $204 per square foot. 763 Main St is a home located in Worcester County with nearby schools including Jacob Hiatt Magnet School, Chandler Elementary Community School, and Chandler Magnet.
Ownership History
Date
Name
Owned For
Owner Type
Purchase Details
Closed on
Sep 10, 2021
Sold by
Worcester Cnty Mgmt Corp
Bought by
S & O Realty Llc
Current Estimated Value
Purchase Details
Closed on
Nov 18, 2020
Sold by
Luong Tommy and Luong Ha T
Bought by
Worcester Cnty Mgmt Corp
Purchase Details
Closed on
Oct 6, 2020
Sold by
Luong Tommy and Luong Ha T
Bought by
Luong Tommy and Luong Ha T
Purchase Details
Closed on
Aug 2, 2011
Sold by
Carlea Inc
Bought by
Lam Ha and Luong Tommy
Create a Home Valuation Report for This Property
The Home Valuation Report is an in-depth analysis detailing your home's value as well as a comparison with similar homes in the area
Home Values in the Area
Average Home Value in this Area
Purchase History
| Date | Buyer | Sale Price | Title Company |
|---|---|---|---|
| S & O Realty Llc | -- | None Available | |
| Worcester Cnty Mgmt Corp | $260,000 | None Available | |
| Luong Tommy | -- | None Available | |
| Lam Ha | $117,000 | -- |
Source: Public Records
Tax History
| Year | Tax Paid | Tax Assessment Tax Assessment Total Assessment is a certain percentage of the fair market value that is determined by local assessors to be the total taxable value of land and additions on the property. | Land | Improvement |
|---|---|---|---|---|
| 2025 | $5,979 | $209,000 | $52,400 | $156,600 |
| 2024 | $6,194 | $206,200 | $52,400 | $153,800 |
| 2023 | $5,817 | $186,100 | $45,500 | $140,600 |
| 2022 | $5,579 | $167,400 | $45,500 | $121,900 |
| 2021 | $6,983 | $192,900 | $34,700 | $158,200 |
| 2020 | $7,074 | $201,200 | $34,700 | $166,500 |
| 2019 | $6,990 | $200,300 | $33,800 | $166,500 |
| 2018 | $6,649 | $195,400 | $33,800 | $161,600 |
| 2017 | $6,276 | $190,600 | $33,800 | $156,800 |
| 2016 | $5,155 | $151,700 | $29,900 | $121,800 |
| 2015 | $4,813 | $151,700 | $29,900 | $121,800 |
| 2014 | $4,677 | $151,700 | $29,900 | $121,800 |
Source: Public Records
Map
Nearby Homes
- 2 Preston St
- 4 Preston St
- 12 Oread St
- 69 Oread St
- 12 King St
- 146 -152 Chandler
- 70 Southbridge St Unit 611
- 70 Southbridge St Unit 310
- 70 Southbridge St Unit 703
- 6 Chatham Place Unit 6
- 5 Ripley Place
- 8 Crown St
- 7 Bluff St
- 2 Lodi St Unit B
- 2 Lodi St Unit A
- 531 Main St Unit 201
- 531 Main St Unit 403
- 17 Federal St Unit 210
- 200 Beacon St
- 35 May St
- 761 Main St
- 765 Main St
- 765 Main St
- 751 Main St
- 1 Jackson St
- 5 Jackson St
- 7 Jackson St
- 739 Main St
- 12 Jackson St
- 315 Ave Nestor Olivas Unit Calle 25 y 26
- 731 Main St
- 24 Jackson St
- 721 Main St
- 17 Hermon St
- 9 Lagrange St
- 722 Main St Unit lower level
- 722 Main St
- 36 Jackson St
- 776 Main St
- 33 Hermon St Unit GL-1
Your Personal Tour Guide
Ask me questions while you tour the home.