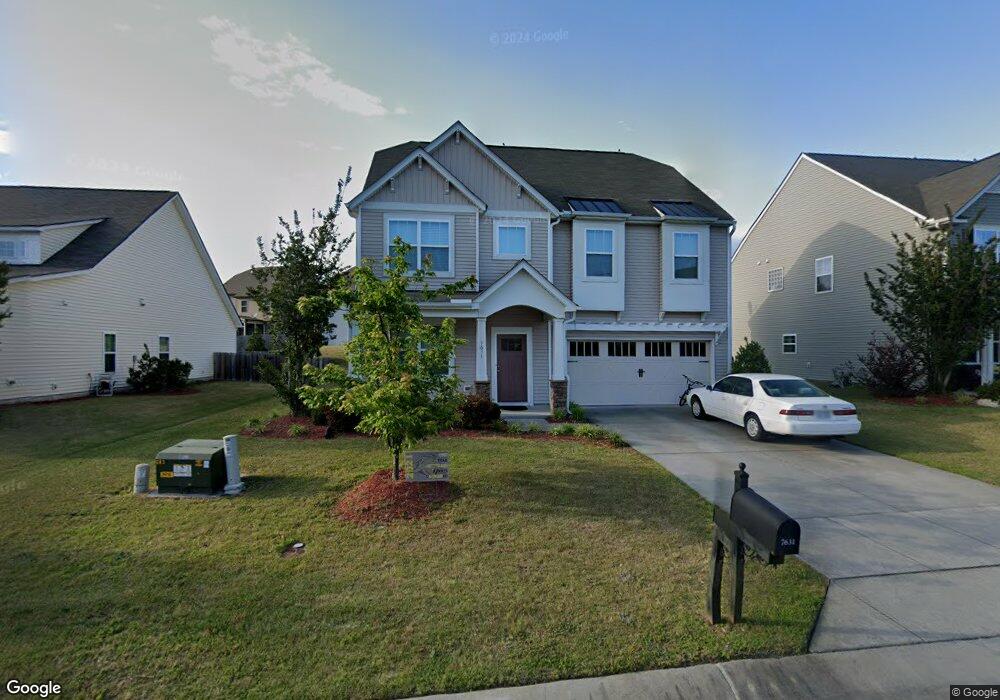
7631 Birchmoor Way Unit Lt89 Raleigh, NC 27616
Northeast Raleigh NeighborhoodEstimated Value: $427,492 - $466,000
3
Beds
3
Baths
2,288
Sq Ft
$196/Sq Ft
Est. Value
About This Home
This home is located at 7631 Birchmoor Way Unit Lt89, Raleigh, NC 27616 and is currently estimated at $448,623, approximately $196 per square foot. 7631 Birchmoor Way Unit Lt89 is a home located in Wake County with nearby schools including Forestville Road Elementary School, Neuse River Middle School, and Knightdale High.
Ownership History
Date
Name
Owned For
Owner Type
Purchase Details
Closed on
Aug 21, 2019
Sold by
Dunkirk Llc
Bought by
Salapo Watson and Mavumbu Mireille
Current Estimated Value
Home Financials for this Owner
Home Financials are based on the most recent Mortgage that was taken out on this home.
Original Mortgage
$280,000
Outstanding Balance
$245,228
Interest Rate
3.7%
Mortgage Type
New Conventional
Estimated Equity
$203,395
Purchase Details
Closed on
Jan 23, 2019
Sold by
Ellerbe Gustave and Ellerbe Tanya
Bought by
Dunkirk Llc
Purchase Details
Closed on
Mar 21, 2013
Sold by
D R Horton Inc
Bought by
Ellerbe Gustave and Ellerbe Tanya
Home Financials for this Owner
Home Financials are based on the most recent Mortgage that was taken out on this home.
Original Mortgage
$206,051
Interest Rate
4.25%
Mortgage Type
Adjustable Rate Mortgage/ARM
Create a Home Valuation Report for This Property
The Home Valuation Report is an in-depth analysis detailing your home's value as well as a comparison with similar homes in the area
Home Values in the Area
Average Home Value in this Area
Purchase History
| Date | Buyer | Sale Price | Title Company |
|---|---|---|---|
| Salapo Watson | $280,000 | None Available | |
| Dunkirk Llc | $2,134 | None Available | |
| Dunkirk Llc | $3,000 | None Listed On Document | |
| Ellerbe Gustave | $206,500 | None Available |
Source: Public Records
Mortgage History
| Date | Status | Borrower | Loan Amount |
|---|---|---|---|
| Open | Salapo Watson | $280,000 | |
| Previous Owner | Ellerbe Gustave | $206,051 |
Source: Public Records
Tax History Compared to Growth
Tax History
| Year | Tax Paid | Tax Assessment Tax Assessment Total Assessment is a certain percentage of the fair market value that is determined by local assessors to be the total taxable value of land and additions on the property. | Land | Improvement |
|---|---|---|---|---|
| 2025 | $3,216 | $366,497 | $80,000 | $286,497 |
| 2024 | $3,203 | $366,497 | $80,000 | $286,497 |
| 2023 | $3,021 | $275,357 | $55,000 | $220,357 |
| 2022 | $2,808 | $275,357 | $55,000 | $220,357 |
| 2021 | $2,699 | $275,357 | $55,000 | $220,357 |
| 2020 | $2,650 | $275,357 | $55,000 | $220,357 |
| 2019 | $2,659 | $227,708 | $42,000 | $185,708 |
| 2018 | $2,508 | $227,708 | $42,000 | $185,708 |
| 2017 | $2,389 | $227,708 | $42,000 | $185,708 |
| 2016 | $2,340 | $227,708 | $42,000 | $185,708 |
| 2015 | $2,350 | $225,026 | $38,000 | $187,026 |
| 2014 | $2,229 | $225,026 | $38,000 | $187,026 |
Source: Public Records
Map
Nearby Homes
- 7636 Birchmoor Way
- 7661 Mapleshire Dr
- 7725 Weathered Oak Way
- 7727 Weathered Oak Way
- 7817 Elmshire Way
- 7535 Mapleshire Dr
- 7613 Oakberry Dr
- 7454 Randshire Way
- 7536 Oakberry Dr
- 4004 Mount Moran Rd
- 7316 Birchshire Dr
- 3932 Mount Moran Rd
- 3917 Mount Moran Rd
- LANSING - TRADITIONS Plan at Chapel Townes
- CARSON - TRADITIONS Plan at Chapel Townes
- DENVER - TRADITIONS Plan at Chapel Townes
- 7301 Vanover Dr
- 2108 Brilliant Dr
- 4208 Bluewing Rd
- Callaway Plan at Peace River Village Single Family
- 7631 Birchmoor Way
- 7627 Birchmoor Way Unit LT88
- 7635 Birchmoor Way Unit Lt90
- 7623 Birchmoor Way Unit LT87
- 7629 Mapleshire Dr Unit LT111
- 7629 Mapleshire Dr
- 7639 Birchmoor Way
- 7639 Birchmoor Way Unit Lt91
- 7633 Mapleshire Dr Unit LT110
- 7633 Mapleshire Dr
- 7637 Mapleshire Dr Unit LT109
- 7637 Mapleshire Dr
- 7632 Birchmoor Way
- 7632 Birchmoor Way Unit Lt69
- 7628 Birchmoor Way
- 7628 Birchmoor Way Unit LT70
- 7625 Mapleshire Dr Unit LT112
- 7625 Mapleshire Dr
- 7624 Birchmoor Way Unit Lt71
- 7624 Birchmoor Way