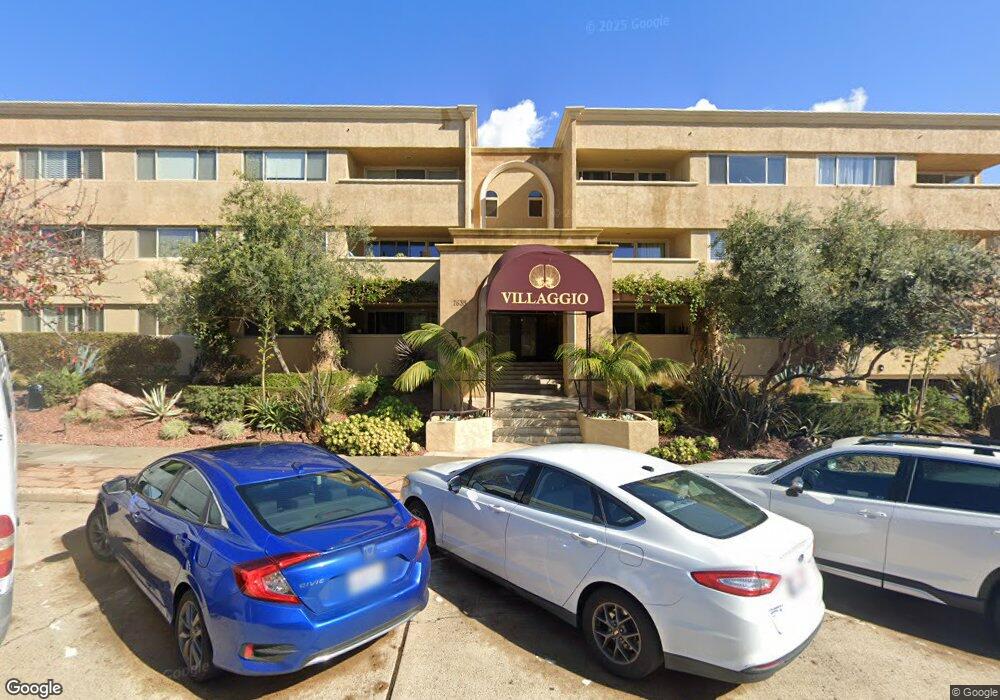
7635 Eads Ave Unit 206 La Jolla, CA 92037
The Village NeighborhoodEstimated Value: $928,000 - $1,466,000
2
Beds
2
Baths
1,180
Sq Ft
$1,085/Sq Ft
Est. Value
About This Home
This home is located at 7635 Eads Ave Unit 206, La Jolla, CA 92037 and is currently estimated at $1,280,489, approximately $1,085 per square foot. 7635 Eads Ave Unit 206 is a home located in San Diego County with nearby schools including La Jolla Elementary School, Muirlands Middle School, and La Jolla High School.
Ownership History
Date
Name
Owned For
Owner Type
Purchase Details
Closed on
Aug 13, 2012
Sold by
Dandliker June K
Bought by
Dandliker June K
Current Estimated Value
Purchase Details
Closed on
Feb 15, 2012
Sold by
Dandliker June K
Bought by
Dandliker June K
Purchase Details
Closed on
May 13, 2009
Sold by
Dandliker Walter B and Dandliker June K
Bought by
Dandliker Walter B and Dandliker June K
Home Financials for this Owner
Home Financials are based on the most recent Mortgage that was taken out on this home.
Original Mortgage
$417,000
Outstanding Balance
$263,044
Interest Rate
4.82%
Mortgage Type
Stand Alone Refi Refinance Of Original Loan
Estimated Equity
$1,017,445
Purchase Details
Closed on
Jul 7, 2008
Sold by
Levin Martin Jay and Levin Gail Ann Vetter
Bought by
Dandliker Walter B and Dandliker June
Home Financials for this Owner
Home Financials are based on the most recent Mortgage that was taken out on this home.
Original Mortgage
$417,000
Interest Rate
6.32%
Mortgage Type
Purchase Money Mortgage
Create a Home Valuation Report for This Property
The Home Valuation Report is an in-depth analysis detailing your home's value as well as a comparison with similar homes in the area
Home Values in the Area
Average Home Value in this Area
Purchase History
| Date | Buyer | Sale Price | Title Company |
|---|---|---|---|
| Dandliker June K | -- | Accommodation | |
| Dandliker June K | -- | Chicago Title Company | |
| Dandliker June K | -- | None Available | |
| Dandliker Walter B | -- | Chicago Title Company | |
| Dandliker Walter B | -- | Chicago Title Company | |
| Dandliker Walter B | $800,000 | Chicago Title Company |
Source: Public Records
Mortgage History
| Date | Status | Borrower | Loan Amount |
|---|---|---|---|
| Open | Dandliker Walter B | $417,000 | |
| Closed | Dandliker Walter B | $417,000 |
Source: Public Records
Tax History
| Year | Tax Paid | Tax Assessment Tax Assessment Total Assessment is a certain percentage of the fair market value that is determined by local assessors to be the total taxable value of land and additions on the property. | Land | Improvement |
|---|---|---|---|---|
| 2025 | $12,444 | $1,030,197 | $740,458 | $289,739 |
| 2024 | $12,444 | $1,009,998 | $725,940 | $284,058 |
| 2023 | $12,168 | $990,195 | $711,706 | $278,489 |
| 2022 | $11,843 | $970,780 | $697,751 | $273,029 |
| 2021 | $11,758 | $951,746 | $684,070 | $267,676 |
| 2020 | $11,616 | $941,988 | $677,056 | $264,932 |
| 2019 | $11,409 | $923,519 | $663,781 | $259,738 |
| 2018 | $10,583 | $905,412 | $650,766 | $254,646 |
| 2017 | $10,417 | $887,659 | $638,006 | $249,653 |
| 2016 | $10,165 | $870,255 | $625,497 | $244,758 |
| 2015 | $10,014 | $857,184 | $616,102 | $241,082 |
| 2014 | $9,854 | $840,394 | $604,034 | $236,360 |
Source: Public Records
Map
Nearby Homes
- 7560 Eads Ave Unit 12
- 7811 Eads Ave Unit 206
- 7811 Eads Ave Unit 311
- 7733 Girard Ave Unit 13
- 7509 Draper Ave Unit 306
- 7520 Draper Ave Unit 3
- 1138 Virginia Way
- 357 Coast Blvd S
- 7447 Herschel Ave
- 7376 Fay Ave
- 1221 Virginia Way
- 7441-43 La Jolla Blvd
- 302 Prospect St Unit 6
- 7365 Draper Ave
- 7421-25 La Jolla Blvd
- 7355 Fay Ave
- 7337 Draper Ave
- 939 Coast Blvd Unit 15E
- 939 Coast Blvd Unit 5E
- 939 Coast Blvd Unit 6A
- 7635 Eads Ave Unit 7635 Eads 303
- 7635 Eads Ave Unit LA JOLLA VILLAGE
- 7635 Eads Ave
- 7635 Eads Ave
- 7635 Eads Ave Unit 306
- 7635 Eads Ave Unit 303
- 7635 Eads Ave Unit 301
- 7635 Eads Ave Unit 307
- 7635 Eads Ave Unit 305
- 7635 Eads Ave Unit 106
- 7635 Eads Ave Unit 302
- 7635 Eads Ave Unit 203
- 7635 Eads Ave Unit 308
- 7635 Eads Ave Unit 208
- 7635 Eads Ave Unit 207
- 7635 Eads Ave Unit 205
- 7635 Eads Ave Unit 204
- 7635 Eads Ave Unit 108
- 7635 Eads Ave Unit 107
- 7635 Eads Ave Unit 201
Your Personal Tour Guide
Ask me questions while you tour the home.