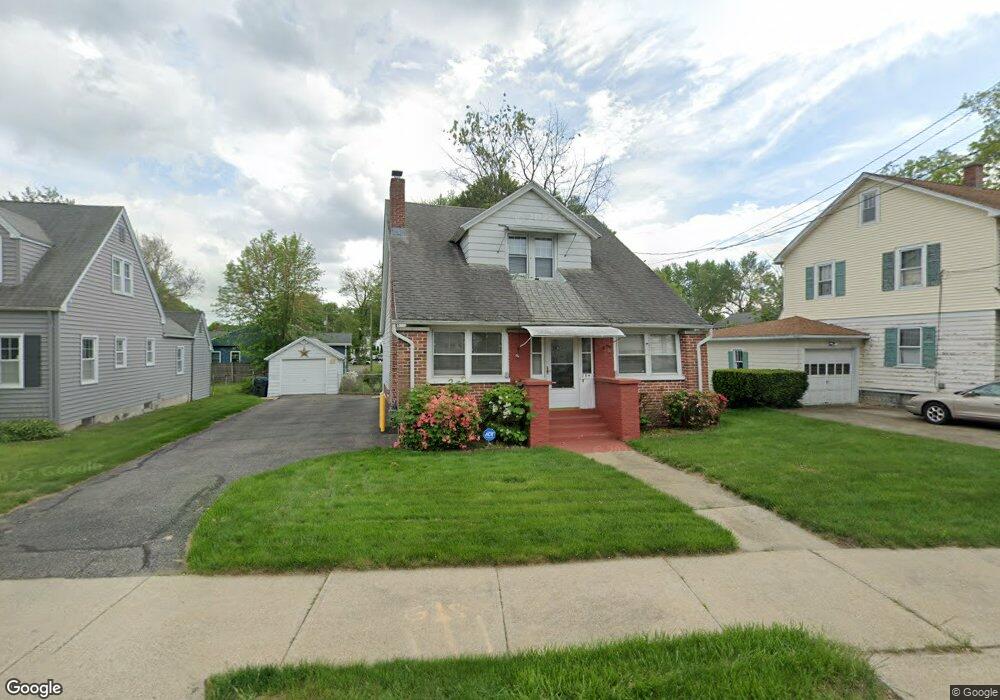
764 Allen St Springfield, MA 01118
East Forest Park NeighborhoodEstimated Value: $279,000 - $314,000
3
Beds
2
Baths
1,571
Sq Ft
$190/Sq Ft
Est. Value
About This Home
This home is located at 764 Allen St, Springfield, MA 01118 and is currently estimated at $298,889, approximately $190 per square foot. 764 Allen St is a home located in Hampden County with nearby schools including Frederick Harris Elementary School, M Marcus Kiley Middle, and Springfield High School of Science and Technology.
Ownership History
Date
Name
Owned For
Owner Type
Purchase Details
Closed on
Jan 28, 1997
Sold by
Siciliano Peter D and Mango Ann M
Bought by
Vasquez Angel J and Vasquez Myrna W
Current Estimated Value
Home Financials for this Owner
Home Financials are based on the most recent Mortgage that was taken out on this home.
Original Mortgage
$77,152
Outstanding Balance
$8,675
Interest Rate
7.5%
Mortgage Type
Purchase Money Mortgage
Estimated Equity
$290,214
Create a Home Valuation Report for This Property
The Home Valuation Report is an in-depth analysis detailing your home's value as well as a comparison with similar homes in the area
Home Values in the Area
Average Home Value in this Area
Purchase History
| Date | Buyer | Sale Price | Title Company |
|---|---|---|---|
| Vasquez Angel J | $77,300 | -- |
Source: Public Records
Mortgage History
| Date | Status | Borrower | Loan Amount |
|---|---|---|---|
| Open | Vasquez Angel J | $77,152 |
Source: Public Records
Tax History
| Year | Tax Paid | Tax Assessment Tax Assessment Total Assessment is a certain percentage of the fair market value that is determined by local assessors to be the total taxable value of land and additions on the property. | Land | Improvement |
|---|---|---|---|---|
| 2025 | $3,790 | $241,700 | $39,000 | $202,700 |
| 2024 | $3,549 | $221,000 | $39,000 | $182,000 |
| 2023 | $3,717 | $218,000 | $40,500 | $177,500 |
| 2022 | $3,113 | $165,400 | $40,500 | $124,900 |
| 2021 | $3,003 | $158,900 | $36,900 | $122,000 |
| 2020 | $2,998 | $153,500 | $36,900 | $116,600 |
| 2019 | $2,795 | $142,000 | $36,900 | $105,100 |
| 2018 | $2,745 | $139,500 | $36,900 | $102,600 |
| 2017 | $2,666 | $135,600 | $36,900 | $98,700 |
| 2016 | $2,581 | $131,300 | $36,900 | $94,400 |
| 2015 | $2,496 | $126,900 | $36,900 | $90,000 |
Source: Public Records
Map
Nearby Homes
- 1088 Sumner Ave
- 79 Roosevelt Ave
- 13 Bither St
- 79 Arvilla St
- 134 Eddywood St
- 34 Castle St
- 119 Powell Ave
- 7 Ashbrook St
- 170 Plumtree Rd
- 77 Dorset St
- 161 Dorset St
- 46 Eckington St
- 854-856 Sumner Ave
- 75 Gillette Cir
- 59 Daviston St
- 88 Brunswick St
- 118 Pilgrim Rd
- 19 Manor Ct Unit 19
- 55 Mandalay Rd
- 125 Manor Ct Unit 125
Your Personal Tour Guide
Ask me questions while you tour the home.