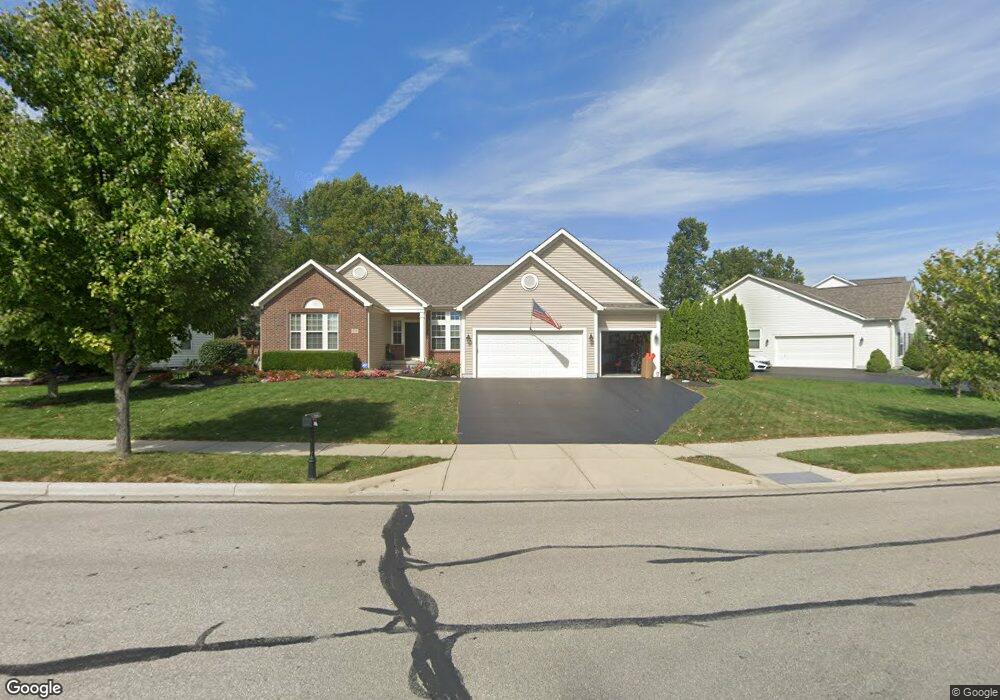
764 Mill Wind Ct E Unit 261 Westerville, OH 43082
Estimated Value: $453,000 - $515,000
3
Beds
3
Baths
1,902
Sq Ft
$249/Sq Ft
Est. Value
About This Home
This home is located at 764 Mill Wind Ct E Unit 261, Westerville, OH 43082 and is currently estimated at $473,175, approximately $248 per square foot. 764 Mill Wind Ct E Unit 261 is a home located in Delaware County with nearby schools including Robert Frost Elementary School, Heritage Middle School, and Westerville-North High School.
Ownership History
Date
Name
Owned For
Owner Type
Purchase Details
Closed on
May 24, 2018
Sold by
Morrison Ii John Richard and Morrison Vicki R
Bought by
Morrison Preservation Trust
Current Estimated Value
Purchase Details
Closed on
Aug 17, 2001
Sold by
Walter Christian T
Bought by
Morrison John R and Morrison Vicki R
Home Financials for this Owner
Home Financials are based on the most recent Mortgage that was taken out on this home.
Original Mortgage
$189,200
Interest Rate
7.23%
Mortgage Type
New Conventional
Purchase Details
Closed on
Jul 20, 1999
Sold by
Mccorkle Investments Co
Bought by
Walter Christian T and Walter Angela R
Home Financials for this Owner
Home Financials are based on the most recent Mortgage that was taken out on this home.
Original Mortgage
$198,900
Interest Rate
7.43%
Mortgage Type
Balloon
Create a Home Valuation Report for This Property
The Home Valuation Report is an in-depth analysis detailing your home's value as well as a comparison with similar homes in the area
Home Values in the Area
Average Home Value in this Area
Purchase History
| Date | Buyer | Sale Price | Title Company |
|---|---|---|---|
| Morrison Preservation Trust | -- | None Available | |
| Morrison John R | $222,700 | -- | |
| Walter Christian T | $221,000 | -- |
Source: Public Records
Mortgage History
| Date | Status | Borrower | Loan Amount |
|---|---|---|---|
| Previous Owner | Morrison John R | $189,200 | |
| Previous Owner | Walter Christian T | $198,900 |
Source: Public Records
Tax History
| Year | Tax Paid | Tax Assessment Tax Assessment Total Assessment is a certain percentage of the fair market value that is determined by local assessors to be the total taxable value of land and additions on the property. | Land | Improvement |
|---|---|---|---|---|
| 2024 | $7,035 | $138,080 | $30,870 | $107,210 |
| 2023 | $6,954 | $138,080 | $30,870 | $107,210 |
| 2022 | $6,799 | $104,440 | $21,140 | $83,300 |
| 2021 | $6,857 | $104,440 | $21,140 | $83,300 |
| 2020 | $6,953 | $104,440 | $21,140 | $83,300 |
| 2019 | $6,008 | $86,110 | $18,380 | $67,730 |
| 2018 | $5,907 | $86,110 | $18,380 | $67,730 |
| 2017 | $3,255 | $82,400 | $13,830 | $68,570 |
| 2016 | $6,165 | $82,400 | $13,830 | $68,570 |
| 2015 | $5,849 | $82,400 | $13,830 | $68,570 |
| 2014 | $5,908 | $82,400 | $13,830 | $68,570 |
| 2013 | $5,631 | $78,510 | $13,830 | $64,680 |
Source: Public Records
Map
Nearby Homes
- 852 Karen Ct
- 478 Burns Dr N
- 629 Andrew Ave
- 570 Susan Ave
- 222 Juniper Ave
- 660 Albion Place Unit 8660
- 787 Centerpark Dr
- 687 E College Ave
- 192 Sassafras Way
- 262 Crawford Ct
- 1075 Carousel Ct
- 393 Canterbury Ct
- 373 Wyndham Park S
- 30 Kim Ct W
- 1103 Blue Heron Dr
- 961 E College Ave
- 62 College Place
- 390 Ashford Dr
- 192 Buckeye Ct
- 339 Aylesbury Dr S
- 764 Mill Wind Ct E
- 772 Mill Wind Ct E
- 348 Mill Wind Ct S
- 356 Mill Wind Ct S
- 765 Grindstone Dr
- 780 Mill Wind Ct E
- 765 Grindstone Rd
- 364 Mill Wind Ct S
- 767 Mill Wind Ct E
- 336 Mill Wind Ct S
- 773 Mill Wind Ct E
- 786 Mill Wind Ct E
- 353 Mill Wind Ct S
- 359 Millwind Ct S
- 359 Mill Wind Ct S
- 781 Mill Wind Ct E
- 349 Mill Wind Ct S
- 328 Mill Wind Ct S
- 365 Mill Wind Ct S
- 343 Mill Wind Ct S
Your Personal Tour Guide
Ask me questions while you tour the home.