764 S Main St Middletown, CT 06457
Estimated Value: $476,000 - $816,000
About This Home
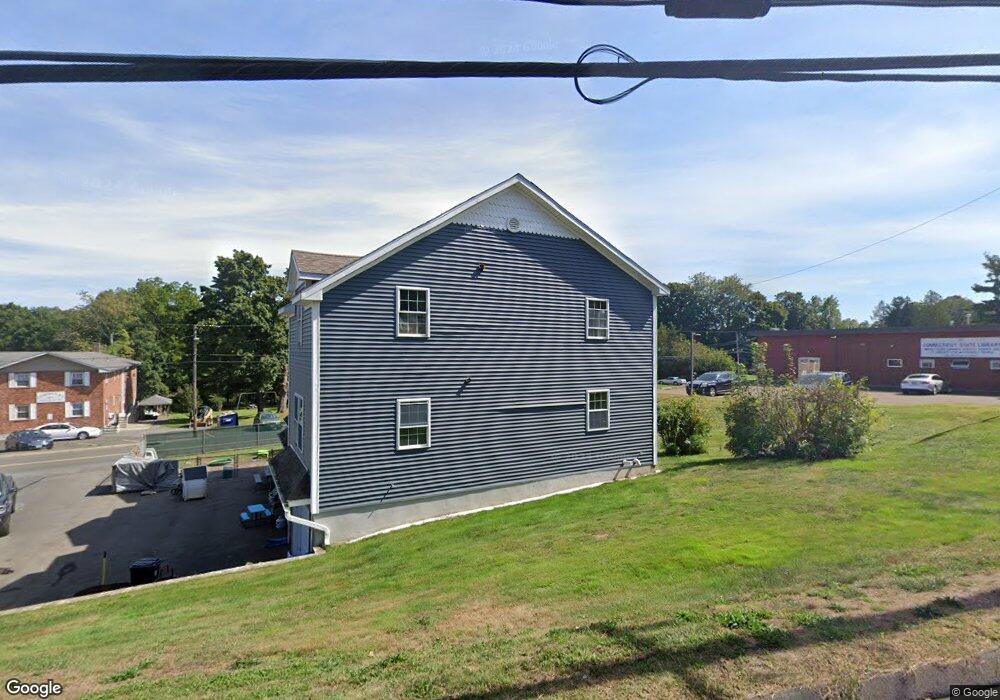
This home is located at 764 S Main St, Middletown, CT 06457 and is currently estimated at $617,202, approximately $958 per square foot. 764 S Main St is a home located in Middlesex County with nearby schools including Wilbert Snow Elementary School, Middletown High School, and St John Paul II School.
Ownership History
We collect this data history from publicly available records. To have your information removed, we recommend requesting removal directly through your county’s website.
Purchase Details
Purchase Details
Purchase Details
Purchase Details
Home Financials for this Owner
Home Financials are based on the most recent Mortgage that was taken out on this home.Purchase History
We collect this data history from publicly available records. To have your information removed, we recommend requesting removal directly through your county’s website.
| Date | Buyer | Sale Price | Title Company |
|---|---|---|---|
| -- | None Available | ||
| -- | None Available | ||
| -- | -- | ||
| $115,000 | -- | ||
| $45,000 | -- | ||
| -- | -- | ||
| $115,000 | -- | ||
| $45,000 | -- |
Mortgage History
We collect this data history from publicly available records. To have your information removed, we recommend requesting removal directly through your county’s website.
| Date | Status | Borrower | Loan Amount |
|---|---|---|---|
| Previous Owner | $33,750 |
Tax History
We collect this data history from publicly available records. To have your information removed, we recommend requesting removal directly through your county’s website.
| Year | Tax Paid | Tax Assessment Tax Assessment Total Assessment is a certain percentage of the fair market value that is determined by local assessors to be the total taxable value of land and additions on the property. | Land | Improvement |
|---|---|---|---|---|
| 2025 | $16,532 | $446,670 | $58,740 | $387,930 |
| 2024 | $13,641 | $385,210 | $58,740 | $326,470 |
| 2023 | $12,947 | $385,210 | $58,740 | $326,470 |
| 2022 | $10,290 | $249,420 | $26,110 | $223,310 |
| 2021 | $10,244 | $249,420 | $26,110 | $223,310 |
| 2020 | $10,227 | $249,420 | $26,110 | $223,310 |
| 2019 | $10,234 | $248,380 | $26,110 | $222,270 |
| 2018 | $9,881 | $248,380 | $26,110 | $222,270 |
| 2017 | $6,802 | $175,860 | $40,450 | $135,410 |
| 2016 | $3,816 | $100,670 | $40,450 | $60,220 |
| 2015 | $3,732 | $100,670 | $40,450 | $60,220 |
| 2014 | $2,010 | $54,270 | $40,450 | $13,820 |
Map
- 0 Pinewood Terrace Unit G654742
- 0 Durwin St
- 9 Durwin St
- 769 S Main St
- 761 S Main St
- 19 Pinewood Terrace
- 4 Durwin St
- 749 S Main St
- 749 S Main St Unit B
- 465 Highland Ave
- 9 Pinewood Terrace
- 10 Durwin St
- 23 Durwin St
- 745 S Main St
- 18 Durwin St
- 483 Highland Ave
- 710 S Main St
- 27 Durwin St
- 28 Durwin St
- 493 Highland Ave
Ask me questions while you tour the home.