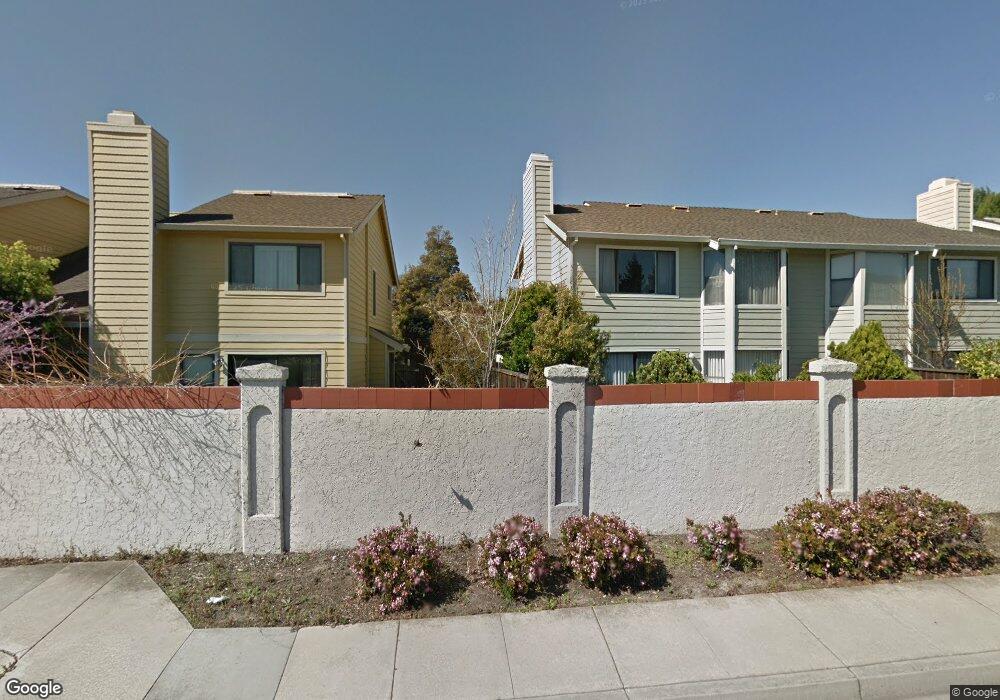
764 Superior Rd Milpitas, CA 95035
Estimated Value: $1,536,000 - $1,642,000
3
Beds
3
Baths
1,860
Sq Ft
$857/Sq Ft
Est. Value
About This Home
This home is located at 764 Superior Rd, Milpitas, CA 95035 and is currently estimated at $1,594,056, approximately $857 per square foot. 764 Superior Rd is a home located in Santa Clara County with nearby schools including Curtner Elementary School, Thomas Russell Middle School, and Milpitas High School.
Ownership History
Date
Name
Owned For
Owner Type
Purchase Details
Closed on
Aug 23, 2004
Sold by
Chi Keh Yu and Yang Chun Hung
Bought by
Shah Sandip K and Shah Maitrayee
Current Estimated Value
Home Financials for this Owner
Home Financials are based on the most recent Mortgage that was taken out on this home.
Original Mortgage
$448,000
Outstanding Balance
$207,278
Interest Rate
5%
Mortgage Type
Purchase Money Mortgage
Estimated Equity
$1,386,778
Create a Home Valuation Report for This Property
The Home Valuation Report is an in-depth analysis detailing your home's value as well as a comparison with similar homes in the area
Home Values in the Area
Average Home Value in this Area
Purchase History
| Date | Buyer | Sale Price | Title Company |
|---|---|---|---|
| Shah Sandip K | $560,500 | Chicago Title |
Source: Public Records
Mortgage History
| Date | Status | Borrower | Loan Amount |
|---|---|---|---|
| Open | Shah Sandip K | $448,000 | |
| Closed | Shah Sandip K | $56,000 |
Source: Public Records
Tax History
| Year | Tax Paid | Tax Assessment Tax Assessment Total Assessment is a certain percentage of the fair market value that is determined by local assessors to be the total taxable value of land and additions on the property. | Land | Improvement |
|---|---|---|---|---|
| 2025 | $9,015 | $780,578 | $351,260 | $429,318 |
| 2024 | $9,015 | $765,273 | $344,373 | $420,900 |
| 2023 | $8,987 | $750,269 | $337,621 | $412,648 |
| 2022 | $8,952 | $735,558 | $331,001 | $404,557 |
| 2021 | $8,822 | $721,136 | $324,511 | $396,625 |
| 2020 | $8,669 | $713,743 | $321,184 | $392,559 |
| 2019 | $8,571 | $699,749 | $314,887 | $384,862 |
| 2018 | $8,104 | $686,029 | $308,713 | $377,316 |
| 2017 | $8,001 | $672,578 | $302,660 | $369,918 |
| 2016 | $7,678 | $659,391 | $296,726 | $362,665 |
| 2015 | $7,601 | $649,487 | $292,269 | $357,218 |
| 2014 | $7,397 | $636,765 | $286,544 | $350,221 |
Source: Public Records
Map
Nearby Homes
- 60 Jacklin Place
- 509 Oroville Rd
- 102 Marylinn Dr
- 7280 Marylinn Dr
- 170 Marylinn Dr
- 1199 N Abbott Ave
- 239 Balboa Dr
- 73 Images Cir
- 715 Corinthia Dr
- 5 Pond Ct
- 1046 N Abbott Ave Unit 46
- 322 Sandhurst Dr
- 0 Railroad Ave
- 62 Washington Square Dr
- 603 Penitencia St
- 408 Desert Holly St
- 864 Kizer St
- 591 Marylinn Dr
- 1363 Lilac Way
- 622 Chamise Way
Your Personal Tour Guide
Ask me questions while you tour the home.