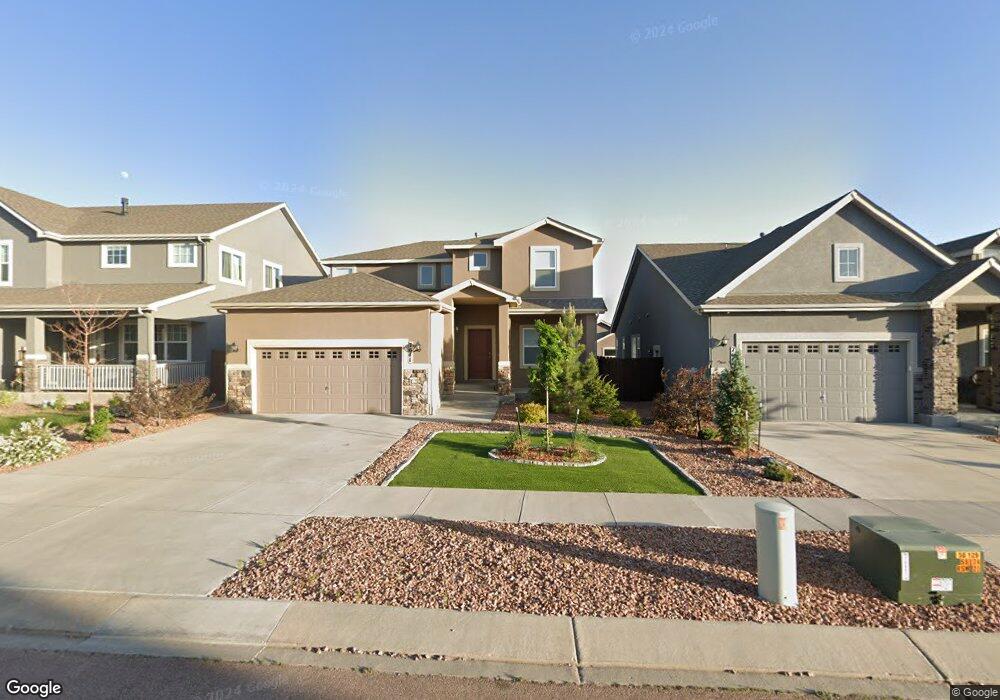
7641 Barraport Dr Colorado Springs, CO 80908
Estimated Value: $536,678 - $638,000
4
Beds
3
Baths
2,772
Sq Ft
$213/Sq Ft
Est. Value
About This Home
This home is located at 7641 Barraport Dr, Colorado Springs, CO 80908 and is currently estimated at $591,170, approximately $213 per square foot. 7641 Barraport Dr is a home with nearby schools including Inspiration View Elementary School, Skyview Middle School, and Vista Ridge High School.
Ownership History
Date
Name
Owned For
Owner Type
Purchase Details
Closed on
Dec 4, 2020
Sold by
Heartling Family Trust
Bought by
Hartling Mary Jean
Current Estimated Value
Home Financials for this Owner
Home Financials are based on the most recent Mortgage that was taken out on this home.
Original Mortgage
$352,000
Outstanding Balance
$313,944
Interest Rate
2.8%
Mortgage Type
New Conventional
Estimated Equity
$277,226
Purchase Details
Closed on
May 5, 2017
Sold by
Haertling Daniel C and Haertling Lois A
Bought by
Haertling Family Trust
Home Financials for this Owner
Home Financials are based on the most recent Mortgage that was taken out on this home.
Original Mortgage
$270,608
Interest Rate
2.87%
Mortgage Type
Adjustable Rate Mortgage/ARM
Purchase Details
Closed on
Nov 2, 2016
Sold by
Cola Llc
Bought by
Aspen View Homes Llc
Create a Home Valuation Report for This Property
The Home Valuation Report is an in-depth analysis detailing your home's value as well as a comparison with similar homes in the area
Home Values in the Area
Average Home Value in this Area
Purchase History
| Date | Buyer | Sale Price | Title Company |
|---|---|---|---|
| Hartling Mary Jean | $440,000 | Unified Title Co | |
| Haertling Family Trust | -- | Unified Title Co | |
| Haertling Daniel C | $338,300 | Unified Title Co | |
| Aspen View Homes Llc | $65,500 | Unified Title Co Inc |
Source: Public Records
Mortgage History
| Date | Status | Borrower | Loan Amount |
|---|---|---|---|
| Open | Hartling Mary Jean | $352,000 | |
| Previous Owner | Haertling Daniel C | $270,608 |
Source: Public Records
Tax History Compared to Growth
Tax History
| Year | Tax Paid | Tax Assessment Tax Assessment Total Assessment is a certain percentage of the fair market value that is determined by local assessors to be the total taxable value of land and additions on the property. | Land | Improvement |
|---|---|---|---|---|
| 2025 | $3,098 | $38,120 | -- | -- |
| 2024 | $2,998 | $36,900 | $6,030 | $30,870 |
| 2023 | $2,998 | $36,900 | $6,030 | $30,870 |
| 2022 | $2,515 | $25,980 | $5,590 | $20,390 |
| 2021 | $3,114 | $26,740 | $5,760 | $20,980 |
| 2020 | $3,235 | $25,910 | $5,010 | $20,900 |
| 2019 | $3,374 | $25,910 | $5,010 | $20,900 |
| 2018 | $2,802 | $21,380 | $4,320 | $17,060 |
| 2017 | $2,674 | $21,380 | $4,320 | $17,060 |
| 2016 | $652 | $5,390 | $5,390 | $0 |
Source: Public Records
Map
Nearby Homes
- 7626 Almond Wood Loop
- 7993 Sandsmere Dr
- 7680 Almond Wood Loop
- 8115 Mustang Rd
- 7750 Sun Shimmer View
- 8040 Barraport Dr
- 7700 Frigid Air Point
- 8036 Carmela Grove Unit 1
- The Pagosa Plan at Aspen Meadows
- The Meadowbrook Plan at Aspen Meadows
- The Crestone Plan at Aspen Meadows
- Elm Plan at Aspen Meadows
- The Stonebridge Plan at Aspen Meadows
- The Telluride Plan at Aspen Meadows
- Boxelder Plan at Aspen Meadows
- Ash Plan at Aspen Meadows
- The Breckenridge Plan at Aspen Meadows
- 7646 Sun Shimmer View
- 7615 Maverick Rd
- 8091 Goldenray Place
- 7651 Barraport Dr
- 7631 Barraport Dr
- 7681 Barraport Dr
- 7621 Barraport Dr
- 8253 Burl Wood Dr
- 8259 Burl Wood Dr
- 7691 Barraport Dr
- 8247 Burl Wood Dr
- 7611 Barraport Dr
- 8265 Burl Wood Dr
- 7630 Barraport Dr
- 7650 Barraport Dr
- 8241 Burl Wood Dr
- 8155 Kenosha Dr
- 7680 Barraport Dr
- 7711 Barraport Dr
- 8165 Kenosha Dr
- 8175 Kenosha Dr
- 8248 Burl Wood Dr
- 7670 Barraport Dr