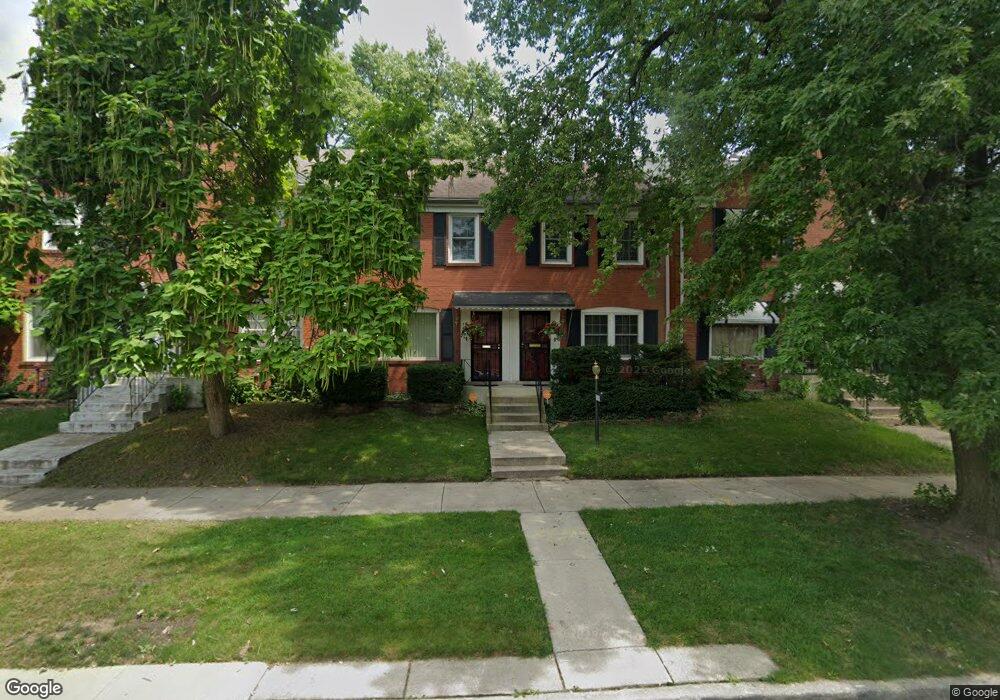
7647 S Euclid Ave Chicago, IL 60649
South Shore NeighborhoodEstimated Value: $118,000 - $147,276
2
Beds
1
Bath
896
Sq Ft
$149/Sq Ft
Est. Value
About This Home
This home is located at 7647 S Euclid Ave, Chicago, IL 60649 and is currently estimated at $133,069, approximately $148 per square foot. 7647 S Euclid Ave is a home located in Cook County with nearby schools including Bouchet Elementary Math & Science Academy, St Paul Lutheran School, and Muhammad University.
Ownership History
Date
Name
Owned For
Owner Type
Purchase Details
Closed on
Jan 27, 2020
Sold by
Narcisse Craig A
Bought by
Chicago Title Land Trust Company and Trust Number 56890
Current Estimated Value
Purchase Details
Closed on
Jan 23, 2004
Sold by
Wright Victoria L
Bought by
Narcisse Craig A
Home Financials for this Owner
Home Financials are based on the most recent Mortgage that was taken out on this home.
Original Mortgage
$62,400
Interest Rate
5.96%
Mortgage Type
Unknown
Purchase Details
Closed on
Feb 26, 1998
Sold by
Burrow Wanda L and Mcduffy Wanda L
Bought by
Wright Victoria L
Home Financials for this Owner
Home Financials are based on the most recent Mortgage that was taken out on this home.
Original Mortgage
$35,583
Interest Rate
7.23%
Mortgage Type
FHA
Purchase Details
Closed on
Sep 5, 1996
Sold by
Mcduffy Herman S and Burrow Wanda L
Bought by
Mcduffy Wanda L and Burrow Wanda L
Create a Home Valuation Report for This Property
The Home Valuation Report is an in-depth analysis detailing your home's value as well as a comparison with similar homes in the area
Home Values in the Area
Average Home Value in this Area
Purchase History
| Date | Buyer | Sale Price | Title Company |
|---|---|---|---|
| Chicago Title Land Trust Company | -- | Chicago Title | |
| Narcisse Craig A | $78,000 | Ticor Title Insurance | |
| Wright Victoria L | $43,500 | -- | |
| Mcduffy Wanda L | -- | -- |
Source: Public Records
Mortgage History
| Date | Status | Borrower | Loan Amount |
|---|---|---|---|
| Previous Owner | Narcisse Craig A | $62,400 | |
| Previous Owner | Wright Victoria L | $35,583 |
Source: Public Records
Tax History Compared to Growth
Tax History
| Year | Tax Paid | Tax Assessment Tax Assessment Total Assessment is a certain percentage of the fair market value that is determined by local assessors to be the total taxable value of land and additions on the property. | Land | Improvement |
|---|---|---|---|---|
| 2024 | $1,270 | $5,900 | $2,540 | $3,360 |
| 2023 | $1,234 | $6,000 | $2,540 | $3,460 |
| 2022 | $1,234 | $6,000 | $2,540 | $3,460 |
| 2021 | $1,207 | $6,000 | $2,540 | $3,460 |
| 2020 | $1,709 | $7,670 | $1,828 | $5,842 |
| 2019 | $1,712 | $8,523 | $1,828 | $6,695 |
| 2018 | $1,684 | $8,523 | $1,828 | $6,695 |
| 2017 | $1,844 | $8,565 | $1,625 | $6,940 |
| 2016 | $1,715 | $8,565 | $1,625 | $6,940 |
| 2015 | $1,570 | $8,565 | $1,625 | $6,940 |
| 2014 | $1,145 | $6,171 | $1,422 | $4,749 |
| 2013 | $1,122 | $6,171 | $1,422 | $4,749 |
Source: Public Records
Map
Nearby Homes
- 7712 S Jeffery Blvd
- 7724 S Chappel Ave
- 7759 S Constance Ave
- 7816 S Jeffery Blvd
- 7621 S Clyde Ave
- 7828 S Jeffery Blvd
- 7741 S Clyde Ave
- 7517 S Chappel Ave
- 7844 S Jeffery Blvd
- 7637 S Ridgeland Ave
- 7707 S Ridgeland Ave
- 7711 S Ridgeland Ave
- 7627 S Ridgeland Ave
- 7846 S Bennett Ave
- 7836 S Constance Ave
- 7449 S Bennett Ave
- 7526 S Merrill Ave
- 7545 S Ridgeland Ave
- 7522 S Merrill Ave
- 7716 S Paxton Ave
- 7649 S Euclid Ave
- 7651 S Euclid Ave
- 7643 S Euclid Ave
- 7645 S Euclid Ave
- 7653 S Euclid Ave
- 7641 S Euclid Ave
- 7639 S Euclid Ave
- 7655 S Euclid Ave
- 7637 S Euclid Ave
- 7635 S Euclid Ave
- 7659 S Euclid Ave
- 7661 S Euclid Ave
- 7633 S Euclid Ave
- 7663 S Euclid Ave
- 7631 S Euclid Ave
- 7640 S Euclid Ave
- 7644 S Euclid Ave
- 7634 S Euclid Ave
- 7665 S Euclid Ave
- 7629 S Euclid Ave