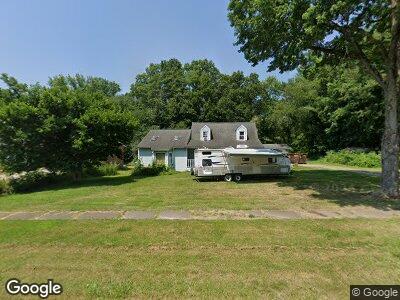
7648 N 2nd Ave Clinton, OH 44216
Clinton NeighborhoodEstimated Value: $158,135 - $218,000
--
Bed
--
Bath
--
Sq Ft
3,572
Sq Ft Lot
About This Home
This home is located at 7648 N 2nd Ave, Clinton, OH 44216 and is currently estimated at $190,045. 7648 N 2nd Ave is a home located in Summit County with nearby schools including Northwest Primary School, W.S. Stinson Elementary School, and Northwest Middle School.
Ownership History
Date
Name
Owned For
Owner Type
Purchase Details
Closed on
Sep 25, 2006
Sold by
Cendant Mobility Financial Corp
Bought by
Pritchett Jill and Prinzo Patric
Current Estimated Value
Home Financials for this Owner
Home Financials are based on the most recent Mortgage that was taken out on this home.
Original Mortgage
$92,800
Outstanding Balance
$60,428
Interest Rate
7.69%
Mortgage Type
Balloon
Estimated Equity
$133,840
Purchase Details
Closed on
Mar 11, 2006
Sold by
Campbell Benjamin C and Powell Campbell Jennifer L
Bought by
Cendant Mobility Financial Corp
Home Financials for this Owner
Home Financials are based on the most recent Mortgage that was taken out on this home.
Original Mortgage
$23,200
Interest Rate
6.38%
Mortgage Type
Stand Alone Second
Create a Home Valuation Report for This Property
The Home Valuation Report is an in-depth analysis detailing your home's value as well as a comparison with similar homes in the area
Home Values in the Area
Average Home Value in this Area
Purchase History
| Date | Buyer | Sale Price | Title Company |
|---|---|---|---|
| Pritchett Jill | $116,000 | Multiple | |
| Cendant Mobility Financial Corp | $125,000 | Multiple |
Source: Public Records
Mortgage History
| Date | Status | Borrower | Loan Amount |
|---|---|---|---|
| Open | Pritchett Jill | $92,800 | |
| Previous Owner | Cendant Mobility Financial Corp | $23,200 | |
| Previous Owner | Campbell Benjamin C | $126,000 | |
| Previous Owner | Campbell Benjamin C | $39,000 | |
| Previous Owner | Campbell Benjamin C | $28,000 | |
| Previous Owner | Campbell Benjamin C | $115,071 |
Source: Public Records
Tax History Compared to Growth
Tax History
| Year | Tax Paid | Tax Assessment Tax Assessment Total Assessment is a certain percentage of the fair market value that is determined by local assessors to be the total taxable value of land and additions on the property. | Land | Improvement |
|---|---|---|---|---|
| 2025 | $227 | $4,484 | $2,212 | $2,272 |
| 2024 | $227 | $4,484 | $2,212 | $2,272 |
| 2023 | $227 | $4,484 | $2,212 | $2,272 |
| 2022 | $214 | $3,672 | $1,400 | $2,272 |
| 2021 | $194 | $3,672 | $1,400 | $2,272 |
| 2020 | $188 | $3,670 | $1,400 | $2,270 |
| 2019 | $178 | $3,160 | $1,190 | $1,970 |
| 2018 | $172 | $3,160 | $1,190 | $1,970 |
| 2017 | $183 | $3,160 | $1,190 | $1,970 |
| 2016 | $182 | $3,060 | $1,090 | $1,970 |
| 2015 | $183 | $3,060 | $1,090 | $1,970 |
| 2014 | $190 | $3,060 | $1,090 | $1,970 |
| 2013 | $231 | $3,640 | $1,450 | $2,190 |
Source: Public Records
Map
Nearby Homes
- 7601 N 5th Ave
- 0 Clinton Rd
- 7975 S Cleveland Massillon Rd
- 2800 Crookston Ln
- 7395 S Cleveland Massillon Rd
- 8177 S Cleveland Massillon Rd Unit 57
- 7140 S Cleveland Massillon Rd
- 317 Alissa Ln
- 321 Alissa Ln
- 18592 Edwards Rd Unit 126
- 6900 Deerfield Ave NW
- 7255 Stonehill Ave NW
- 316 Locust St N
- 16538 Fulton Rd
- 16300 Chibiabos Trail
- V/L 1 Grill Rd
- V/L 2 Grill Rd
- 156 Cherry St W
- V/L 3 Grill Rd
- 3336 Lullaby Ln