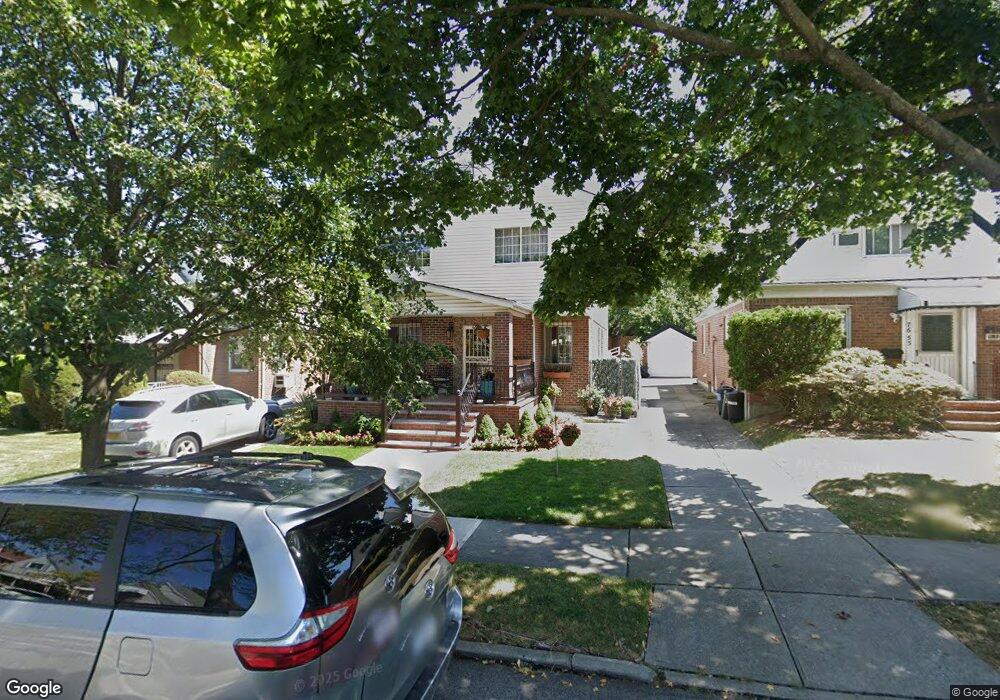
7649 172nd St Fresh Meadows, NY 11366
Hillcrest NeighborhoodEstimated Value: $1,254,000 - $1,694,000
--
Bed
--
Bath
2,000
Sq Ft
$686/Sq Ft
Est. Value
About This Home
This home is located at 7649 172nd St, Fresh Meadows, NY 11366 and is currently estimated at $1,372,093, approximately $686 per square foot. 7649 172nd St is a home located in Queens County with nearby schools including P.S. 173 - Fresh Meadow, George J. Ryan Middle School 216, and Holy Family School.
Ownership History
Date
Name
Owned For
Owner Type
Purchase Details
Closed on
Jun 11, 2012
Sold by
Saedi Bijan
Bought by
Saedi Bijan and Taghizadeh Mahnaz
Current Estimated Value
Purchase Details
Closed on
Mar 31, 1997
Sold by
Welch Anne
Bought by
Saedi Bijan
Home Financials for this Owner
Home Financials are based on the most recent Mortgage that was taken out on this home.
Original Mortgage
$144,000
Interest Rate
7.88%
Create a Home Valuation Report for This Property
The Home Valuation Report is an in-depth analysis detailing your home's value as well as a comparison with similar homes in the area
Home Values in the Area
Average Home Value in this Area
Purchase History
| Date | Buyer | Sale Price | Title Company |
|---|---|---|---|
| Saedi Bijan | -- | -- | |
| Saedi Bijan | $180,000 | Ticor Title Guarantee Compan |
Source: Public Records
Mortgage History
| Date | Status | Borrower | Loan Amount |
|---|---|---|---|
| Previous Owner | Saedi Bijan | $144,000 |
Source: Public Records
Tax History Compared to Growth
Tax History
| Year | Tax Paid | Tax Assessment Tax Assessment Total Assessment is a certain percentage of the fair market value that is determined by local assessors to be the total taxable value of land and additions on the property. | Land | Improvement |
|---|---|---|---|---|
| 2025 | $10,835 | $57,181 | $15,454 | $41,727 |
| 2024 | $7,864 | $53,945 | $17,472 | $36,473 |
| 2023 | $10,835 | $53,945 | $14,830 | $39,115 |
| 2022 | $10,597 | $70,020 | $19,200 | $50,820 |
| 2021 | $10,333 | $62,040 | $19,200 | $42,840 |
| 2020 | $9,790 | $60,780 | $19,200 | $41,580 |
| 2019 | $9,111 | $59,580 | $19,200 | $40,380 |
| 2018 | $8,866 | $44,954 | $16,019 | $28,935 |
| 2017 | $8,718 | $44,236 | $17,584 | $26,652 |
| 2016 | $8,414 | $44,236 | $17,584 | $26,652 |
| 2015 | $5,033 | $39,709 | $21,166 | $18,543 |
| 2014 | $5,033 | $37,462 | $16,963 | $20,499 |
Source: Public Records
Map
Nearby Homes