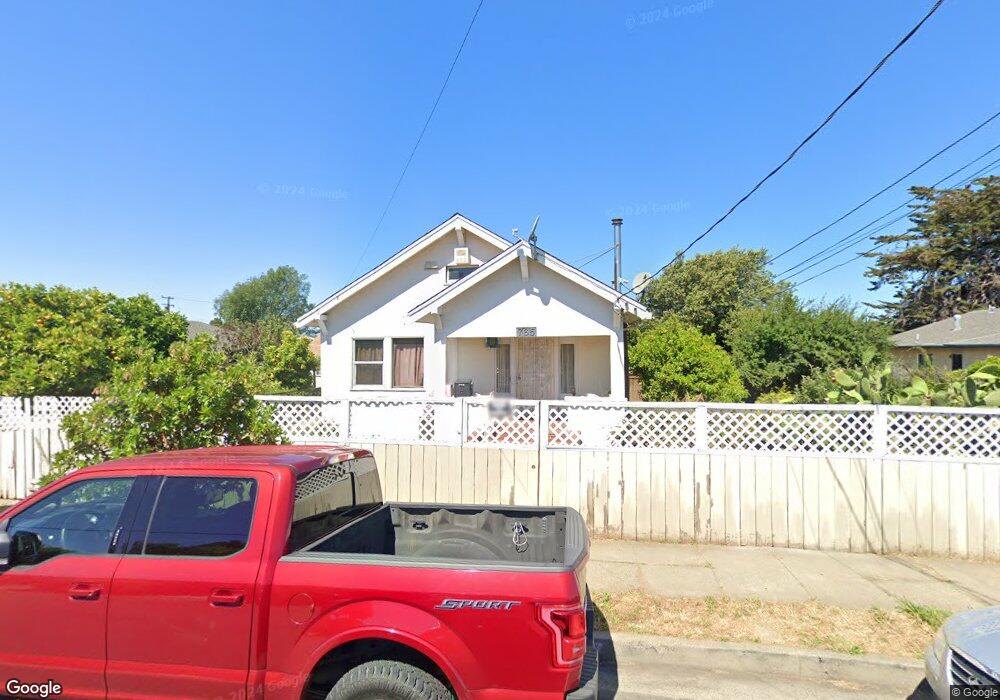
765 9th St Richmond, CA 94801
Iron Triangle NeighborhoodEstimated Value: $460,952 - $505,000
3
Beds
1
Bath
1,260
Sq Ft
$386/Sq Ft
Est. Value
About This Home
This home is located at 765 9th St, Richmond, CA 94801 and is currently estimated at $486,317, approximately $385 per square foot. 765 9th St is a home located in Contra Costa County with nearby schools including Peres Elementary School, Walter T. Helms Middle School, and Richmond High School.
Ownership History
Date
Name
Owned For
Owner Type
Purchase Details
Closed on
Jun 22, 2010
Sold by
Velazquez Antonio and Jimenez Yolanda
Bought by
Hsbc Bank Usa National Association
Current Estimated Value
Purchase Details
Closed on
Jun 15, 2010
Sold by
Hsbc Bank Usa National Associaton
Bought by
Song Jingli
Purchase Details
Closed on
Jan 6, 2009
Sold by
Velazquez Antonio and Jimenez Yolanda
Bought by
Hsbc Bank Usa National Association
Purchase Details
Closed on
Oct 23, 2006
Sold by
Velazquez Antonio and Jimenez Yolanda
Bought by
Velazquez Antonio and Jimenez Yolanda
Home Financials for this Owner
Home Financials are based on the most recent Mortgage that was taken out on this home.
Original Mortgage
$368,000
Interest Rate
7.25%
Mortgage Type
Balloon
Purchase Details
Closed on
Mar 10, 2000
Sold by
Pantaleon Farias
Bought by
Velasquez Antonio and Jimenez Yolanda
Home Financials for this Owner
Home Financials are based on the most recent Mortgage that was taken out on this home.
Original Mortgage
$106,250
Interest Rate
8.21%
Mortgage Type
Purchase Money Mortgage
Purchase Details
Closed on
May 13, 1996
Sold by
Farias Josefina
Bought by
Farias Pantaleon
Home Financials for this Owner
Home Financials are based on the most recent Mortgage that was taken out on this home.
Original Mortgage
$74,284
Interest Rate
7.97%
Mortgage Type
FHA
Create a Home Valuation Report for This Property
The Home Valuation Report is an in-depth analysis detailing your home's value as well as a comparison with similar homes in the area
Home Values in the Area
Average Home Value in this Area
Purchase History
| Date | Buyer | Sale Price | Title Company |
|---|---|---|---|
| Hsbc Bank Usa National Association | $389,903 | Accommodation | |
| Song Jingli | $88,000 | None Available | |
| Hsbc Bank Usa National Association | $389,903 | Accommodation | |
| Velazquez Antonio | -- | North American Title Co | |
| Velasquez Antonio | $125,000 | Old Republic Title Company | |
| Farias Pantaleon | -- | Chicago Title Co | |
| Farias Pantaleon | $84,000 | Chicago Title Co |
Source: Public Records
Mortgage History
| Date | Status | Borrower | Loan Amount |
|---|---|---|---|
| Previous Owner | Velazquez Antonio | $368,000 | |
| Previous Owner | Velasquez Antonio | $106,250 | |
| Previous Owner | Farias Pantaleon | $74,284 |
Source: Public Records
Tax History Compared to Growth
Tax History
| Year | Tax Paid | Tax Assessment Tax Assessment Total Assessment is a certain percentage of the fair market value that is determined by local assessors to be the total taxable value of land and additions on the property. | Land | Improvement |
|---|---|---|---|---|
| 2025 | $2,853 | $96,796 | $12,901 | $83,895 |
| 2024 | $2,828 | $94,899 | $12,649 | $82,250 |
| 2023 | $2,828 | $93,039 | $12,401 | $80,638 |
| 2022 | $2,740 | $91,215 | $12,158 | $79,057 |
| 2021 | $2,669 | $89,427 | $11,920 | $77,507 |
| 2019 | $2,496 | $86,776 | $11,567 | $75,209 |
| 2018 | $2,400 | $85,076 | $11,341 | $73,735 |
| 2017 | $2,325 | $83,409 | $11,119 | $72,290 |
| 2016 | $2,259 | $81,774 | $10,901 | $70,873 |
| 2015 | $2,217 | $80,547 | $10,738 | $69,809 |
| 2014 | $2,205 | $78,970 | $10,528 | $68,442 |
Source: Public Records
Map
Nearby Homes