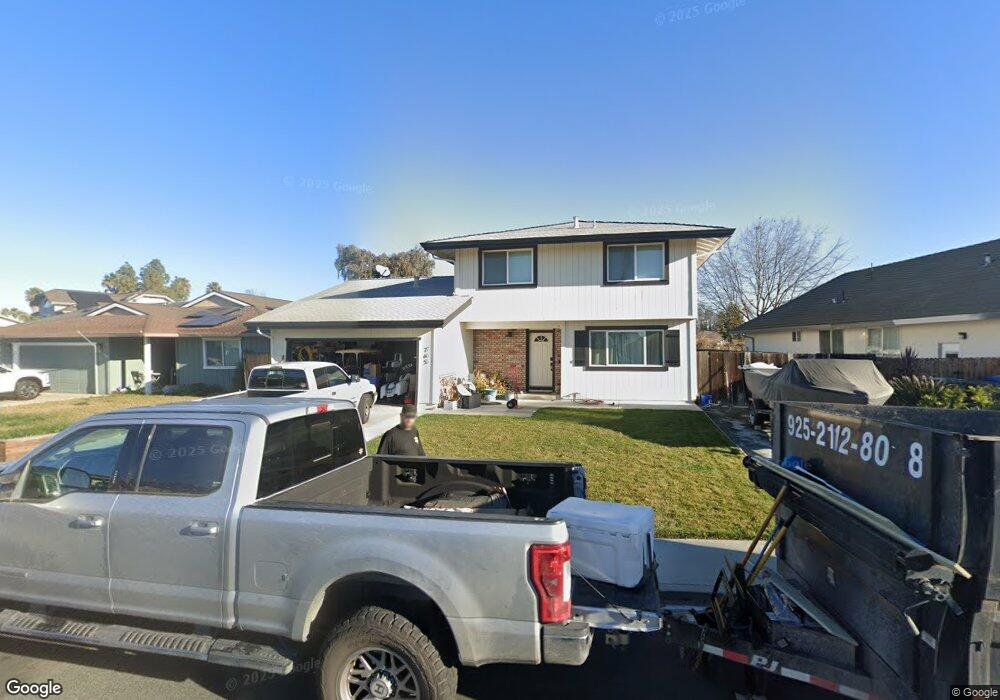
765 Beaver Ln Discovery Bay, CA 94505
Estimated Value: $679,000 - $872,000
3
Beds
3
Baths
1,975
Sq Ft
$389/Sq Ft
Est. Value
About This Home
This home is located at 765 Beaver Ln, Discovery Bay, CA 94505 and is currently estimated at $768,497, approximately $389 per square foot. 765 Beaver Ln is a home located in Contra Costa County with nearby schools including Discovery Bay Elementary School, Excelsior Middle School, and Liberty High School.
Ownership History
Date
Name
Owned For
Owner Type
Purchase Details
Closed on
Jun 26, 2019
Sold by
Two Cousins Property Llc
Bought by
Morrison Nicholas and Morrison Andrea
Current Estimated Value
Home Financials for this Owner
Home Financials are based on the most recent Mortgage that was taken out on this home.
Original Mortgage
$373,600
Outstanding Balance
$328,508
Interest Rate
4%
Mortgage Type
New Conventional
Estimated Equity
$439,989
Purchase Details
Closed on
Dec 14, 2018
Sold by
Miller Janice D
Bought by
Two Cousins Property Llc
Purchase Details
Closed on
Sep 22, 1993
Sold by
Va
Bought by
Carlson Garry L
Home Financials for this Owner
Home Financials are based on the most recent Mortgage that was taken out on this home.
Original Mortgage
$127,500
Interest Rate
6.91%
Mortgage Type
Purchase Money Mortgage
Create a Home Valuation Report for This Property
The Home Valuation Report is an in-depth analysis detailing your home's value as well as a comparison with similar homes in the area
Home Values in the Area
Average Home Value in this Area
Purchase History
| Date | Buyer | Sale Price | Title Company |
|---|---|---|---|
| Morrison Nicholas | $467,000 | Chicago Title Company | |
| Two Cousins Property Llc | $330,000 | Old Republic Title Company | |
| Carlson Garry L | -- | Old Republic Title Company |
Source: Public Records
Mortgage History
| Date | Status | Borrower | Loan Amount |
|---|---|---|---|
| Open | Morrison Nicholas | $373,600 | |
| Previous Owner | Carlson Garry L | $127,500 |
Source: Public Records
Tax History
| Year | Tax Paid | Tax Assessment Tax Assessment Total Assessment is a certain percentage of the fair market value that is determined by local assessors to be the total taxable value of land and additions on the property. | Land | Improvement |
|---|---|---|---|---|
| 2025 | $7,407 | $520,943 | $214,177 | $306,766 |
| 2024 | $6,913 | $510,729 | $209,978 | $300,751 |
| 2023 | $6,913 | $500,715 | $205,861 | $294,854 |
| 2022 | $6,805 | $490,898 | $201,825 | $289,073 |
| 2021 | $6,654 | $481,273 | $197,868 | $283,405 |
| 2019 | $5,115 | $330,000 | $165,000 | $165,000 |
| 2018 | $2,988 | $153,029 | $62,163 | $90,866 |
| 2017 | $3,084 | $150,030 | $60,945 | $89,085 |
| 2016 | $3,098 | $147,089 | $59,750 | $87,339 |
| 2015 | $2,954 | $144,881 | $58,853 | $86,028 |
| 2014 | $2,882 | $142,044 | $57,701 | $84,343 |
Source: Public Records
Map
Nearby Homes
- 730 Beaver Ln
- 870 Willow Lake Rd
- 630 Discovery Bay Blvd
- 5387 Willow Lake Ct
- 5761 Salmon Ct
- 4475 Discovery Point
- 952 Lido Cir
- 1056 Discovery Bay Blvd
- 1205 Beach Ct
- 5055 Cabrillo Point
- 51 Discovery Bay Blvd
- 4741 Discovery Point
- 1271 Discovery Bay Blvd
- 4930 Discovery Point
- 1240 Marina Cir
- 5635 Marlin Dr
- 910 Discovery Bay Blvd
- 550 Lee Loop
- 5726 Marlin Dr
- 5570 Marlin Dr
- 775 Beaver Ln
- 755 Beaver Ln
- 745 Beaver Ln
- 5385 Beaver Ln
- 770 Beaver Ln
- 760 Beaver Ln
- 735 Beaver Ln
- 750 Beaver Ln
- 740 Beaver Ln
- 790 Beaver Ln
- 725 Beaver Ln
- 840 Willow Lake Rd
- 720 Beaver Ln
- 787 Willow Lake Rd
- 850 Willow Lake Rd
- 715 Beaver Ln
- 710 Beaver Ln
- 777 Willow Lake Rd
- 860 Willow Lake Rd
- 5400 Beaver Ln
Your Personal Tour Guide
Ask me questions while you tour the home.