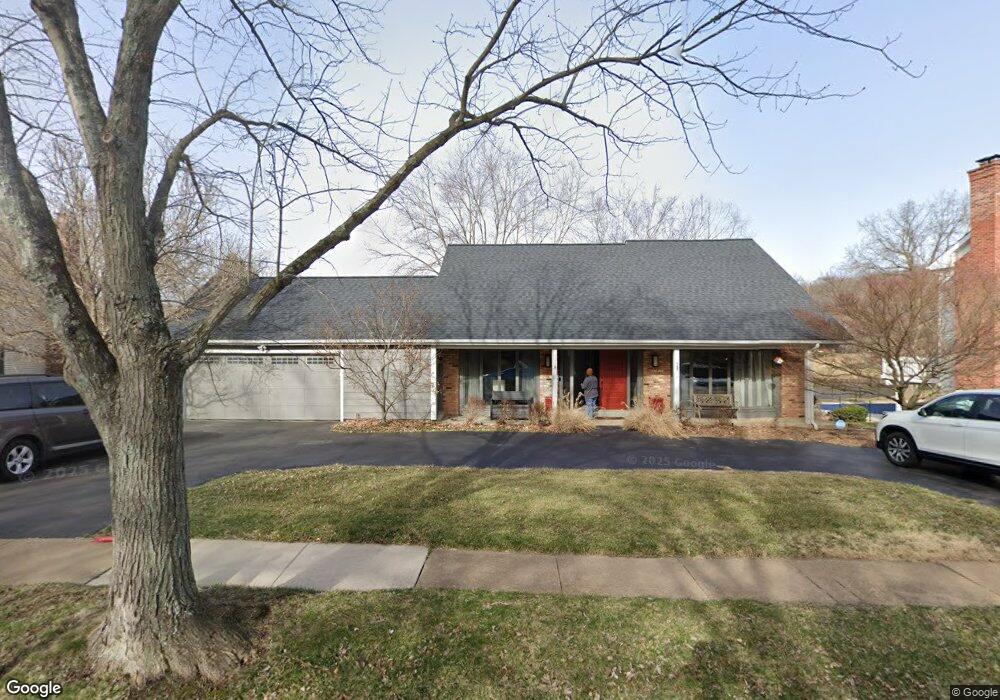
765 Briar Fork Rd Saint Louis, MO 63131
Estimated Value: $621,000 - $643,000
4
Beds
4
Baths
2,186
Sq Ft
$289/Sq Ft
Est. Value
About This Home
This home is located at 765 Briar Fork Rd, Saint Louis, MO 63131 and is currently estimated at $632,087, approximately $289 per square foot. 765 Briar Fork Rd is a home located in St. Louis County with nearby schools including Barretts Elementary School, Parkway South Middle School, and Parkway South High School.
Ownership History
Date
Name
Owned For
Owner Type
Purchase Details
Closed on
Jun 4, 2007
Sold by
Lewis Sharon Kay and Lewis Jefferey Oman
Bought by
Glyshaw Mark R and Glyshaw Kimberly D
Current Estimated Value
Home Financials for this Owner
Home Financials are based on the most recent Mortgage that was taken out on this home.
Original Mortgage
$272,000
Outstanding Balance
$166,165
Interest Rate
6.16%
Mortgage Type
Purchase Money Mortgage
Estimated Equity
$465,922
Purchase Details
Closed on
Mar 1, 2007
Sold by
Herget Carol Ann
Bought by
Lewis Sharon Kay
Purchase Details
Closed on
Apr 6, 2006
Sold by
Niemoeller Stanley E
Bought by
Niemoeller Stanley E and Lewis Sharon Kay
Purchase Details
Closed on
Oct 18, 2002
Sold by
Jin Min and Niemoeller Min Jin
Bought by
Niemoeller Stanley E
Create a Home Valuation Report for This Property
The Home Valuation Report is an in-depth analysis detailing your home's value as well as a comparison with similar homes in the area
Home Values in the Area
Average Home Value in this Area
Purchase History
| Date | Buyer | Sale Price | Title Company |
|---|---|---|---|
| Glyshaw Mark R | $340,000 | None Available | |
| Lewis Sharon Kay | -- | None Available | |
| Herget Carol Ann | -- | None Available | |
| Niemoeller Stanley E | -- | None Available | |
| Niemoeller Stanley E | -- | None Available | |
| Niemoeller Stanley E | -- | -- |
Source: Public Records
Mortgage History
| Date | Status | Borrower | Loan Amount |
|---|---|---|---|
| Open | Glyshaw Mark R | $272,000 |
Source: Public Records
Tax History Compared to Growth
Tax History
| Year | Tax Paid | Tax Assessment Tax Assessment Total Assessment is a certain percentage of the fair market value that is determined by local assessors to be the total taxable value of land and additions on the property. | Land | Improvement |
|---|---|---|---|---|
| 2025 | $5,275 | $121,570 | $71,500 | $50,070 |
| 2024 | $5,275 | $93,200 | $43,700 | $49,500 |
| 2023 | $5,198 | $93,200 | $43,700 | $49,500 |
| 2022 | $4,973 | $81,020 | $39,730 | $41,290 |
| 2021 | $4,931 | $81,020 | $39,730 | $41,290 |
| 2020 | $4,763 | $74,800 | $33,250 | $41,550 |
| 2019 | $4,662 | $74,800 | $33,250 | $41,550 |
| 2018 | $4,807 | $71,310 | $33,250 | $38,060 |
| 2017 | $4,742 | $71,310 | $33,250 | $38,060 |
| 2016 | $4,805 | $68,690 | $26,030 | $42,660 |
| 2015 | $5,147 | $68,690 | $26,030 | $42,660 |
| 2014 | $4,592 | $66,420 | $19,950 | $46,470 |
Source: Public Records
Map
Nearby Homes
- 2300 E Royal Ct
- 2405 Fairoyal Dr
- 2211 Viewroyal Dr
- 13124 Huntercreek Ridge Rd
- 12819 Huntercreek Rd
- 13385 Hiddendale Ln Unit 93
- 12213 Brook Springs Ct
- 2145 Trailcrest Dr
- 13156 Dougherty Ridge Ct
- 2527 Barrett Place Dr
- 591-593 N Ballas Rd
- 2037 Trailcrest Ln Unit 7
- 698 Trailcrest Ct Unit 5
- 467 Tree Top Ln
- 9 Enclave Dr
- 11 Enclave Dr
- 2033 Woodland Knoll
- 1848 Ridgeview Circle Dr
- 2025 Woodland Knoll
- 4 Enclave Dr
- 777 Briar Fork Rd
- 751 Briar Fork Rd
- 793 Briar Fork Rd
- 743 Briar Fork Rd
- 764 Briar Fork Rd
- 12930 Briar Fork Rd
- 12951 Beaver Dam Rd
- 742 Briar Fork Rd
- 792 Haw Thicket Ln
- 12959 Beaver Dam Rd
- 12925 Beaver Dam Rd
- 12948 Briar Fork Rd
- 787 Haw Thicket Ln
- 2350 Camberwell Dr
- 12936 Briar Fork Ct
- 723 Briar Fork Rd
- 12962 Briar Fork Rd
- 2344 Camberwell Dr
- 788 Haw Thicket Ln
- 720 Briar Fork Rd