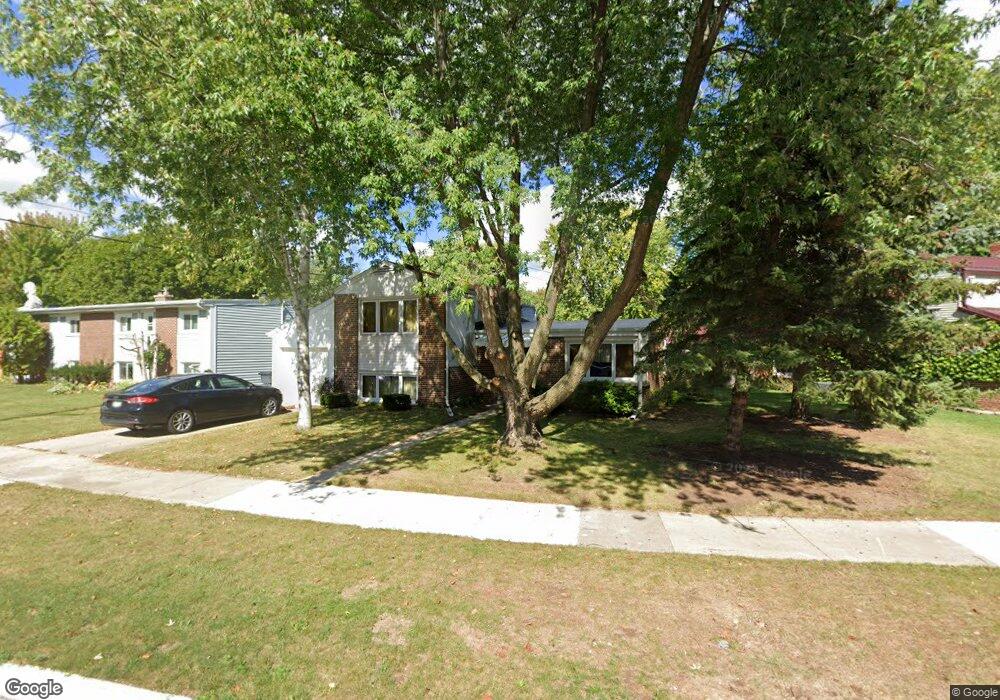
765 Chestnut St Neenah, WI 54956
Estimated Value: $203,433 - $300,000
2
Beds
1
Bath
2,936
Sq Ft
$81/Sq Ft
Est. Value
About This Home
This home is located at 765 Chestnut St, Neenah, WI 54956 and is currently estimated at $239,144, approximately $81 per square foot. 765 Chestnut St is a home located in Winnebago County with nearby schools including Horace Mann Middle School, Horace Mann Elementary School, and Neenah Middle School.
Ownership History
Date
Name
Owned For
Owner Type
Purchase Details
Closed on
Nov 25, 2024
Sold by
Hughes Cheryl and Miller Heidi
Bought by
Zhu Yuxiong and Yang Fan
Current Estimated Value
Home Financials for this Owner
Home Financials are based on the most recent Mortgage that was taken out on this home.
Original Mortgage
$210,000
Outstanding Balance
$208,234
Interest Rate
6.44%
Mortgage Type
New Conventional
Estimated Equity
$30,910
Purchase Details
Closed on
May 12, 2021
Sold by
Inti Investments Llc
Bought by
Hughes Cheryl and Miller Heidi
Home Financials for this Owner
Home Financials are based on the most recent Mortgage that was taken out on this home.
Original Mortgage
$110,000
Interest Rate
3.1%
Mortgage Type
New Conventional
Purchase Details
Closed on
Jul 26, 2005
Sold by
Ziebell Loretta E
Bought by
Lez Properties Llc
Create a Home Valuation Report for This Property
The Home Valuation Report is an in-depth analysis detailing your home's value as well as a comparison with similar homes in the area
Home Values in the Area
Average Home Value in this Area
Purchase History
| Date | Buyer | Sale Price | Title Company |
|---|---|---|---|
| Zhu Yuxiong | $316,500 | None Listed On Document | |
| Zhu Yuxiong | $316,500 | None Listed On Document | |
| Hughes Cheryl | $210,000 | None Listed On Document | |
| Lez Properties Llc | -- | None Available |
Source: Public Records
Mortgage History
| Date | Status | Borrower | Loan Amount |
|---|---|---|---|
| Open | Zhu Yuxiong | $210,000 | |
| Closed | Zhu Yuxiong | $210,000 | |
| Previous Owner | Hughes Cheryl | $110,000 |
Source: Public Records
Tax History Compared to Growth
Tax History
| Year | Tax Paid | Tax Assessment Tax Assessment Total Assessment is a certain percentage of the fair market value that is determined by local assessors to be the total taxable value of land and additions on the property. | Land | Improvement |
|---|---|---|---|---|
| 2024 | $3,702 | $192,100 | $19,500 | $172,600 |
| 2023 | $4,205 | $139,300 | $18,800 | $120,500 |
| 2022 | $4,159 | $104,000 | $23,000 | $81,000 |
| 2021 | $3,801 | $100,500 | $23,000 | $77,500 |
| 2020 | $1,994 | $100,500 | $23,000 | $77,500 |
| 2019 | $3,652 | $100,500 | $23,000 | $77,500 |
| 2018 | $3,590 | $77,300 | $17,700 | $59,600 |
| 2017 | $3,636 | $77,300 | $17,700 | $59,600 |
| 2016 | $2,705 | $77,300 | $17,700 | $59,600 |
| 2015 | $2,668 | $100,000 | $18,800 | $81,200 |
| 2014 | $2,641 | $100,000 | $18,800 | $81,200 |
| 2013 | $2,647 | $100,000 | $18,800 | $81,200 |
Source: Public Records
Map
Nearby Homes
- 949 Higgins Ave
- 870 Maple St
- 926 Congress St
- 525 Pembrook Ct
- 618 Oak St
- 136 Langley Blvd Unit 138
- 649 Stevens St
- 145 Langley Blvd
- 724 Mitchell St
- 650 Stevens St
- 708 Maple St
- 529 Fairview Ave
- 522 Washington Ave
- 335 Washington Ave
- 410 E Franklin Ave
- 214 W Peckham St
- 310 Elm St
- 127 Spruce St
- 625 Cleveland St
- 0 S Park Ave