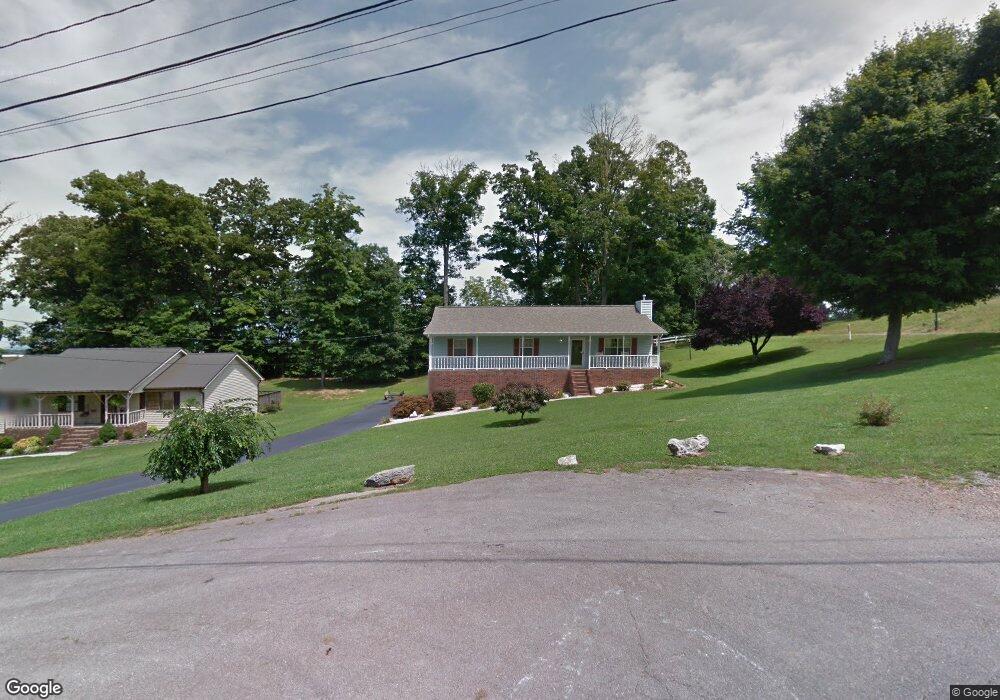
765 Pritchard Dr Morristown, TN 37813
Estimated Value: $251,817 - $302,000
--
Bed
2
Baths
1,680
Sq Ft
$164/Sq Ft
Est. Value
About This Home
This home is located at 765 Pritchard Dr, Morristown, TN 37813 and is currently estimated at $275,954, approximately $164 per square foot. 765 Pritchard Dr is a home located in Hamblen County with nearby schools including Hillcrest Elementary School, Meadowview Middle School, and Morristown East High School.
Ownership History
Date
Name
Owned For
Owner Type
Purchase Details
Closed on
Jun 2, 2017
Sold by
Winstead Larry L and Winstead Linda J
Bought by
Winstead Larry L and Winstead Linda J
Current Estimated Value
Home Financials for this Owner
Home Financials are based on the most recent Mortgage that was taken out on this home.
Original Mortgage
$207,000
Outstanding Balance
$173,576
Interest Rate
4.32%
Mortgage Type
Reverse Mortgage Home Equity Conversion Mortgage
Estimated Equity
$102,378
Purchase Details
Closed on
Sep 14, 1989
Bought by
Winstead Larry L and Winstead Linda S
Purchase Details
Closed on
Dec 30, 1988
Bought by
Hodge Darrell and Hodge Becky
Purchase Details
Closed on
Dec 16, 1988
Bought by
R H C Investments
Purchase Details
Closed on
Apr 25, 1988
Bought by
Hooban Ii H Louis
Purchase Details
Closed on
Nov 12, 1985
Bought by
Hooban Homer L and Hooban Enid L
Purchase Details
Closed on
Jan 1, 1984
Create a Home Valuation Report for This Property
The Home Valuation Report is an in-depth analysis detailing your home's value as well as a comparison with similar homes in the area
Home Values in the Area
Average Home Value in this Area
Purchase History
| Date | Buyer | Sale Price | Title Company |
|---|---|---|---|
| Winstead Larry L | -- | None Available | |
| Winstead Larry L | $69,000 | -- | |
| Hodge Darrell | $11,500 | -- | |
| R H C Investments | $10,000 | -- | |
| Hooban Ii H Louis | $8,000 | -- | |
| Hooban Homer L | -- | -- | |
| -- | -- | -- |
Source: Public Records
Mortgage History
| Date | Status | Borrower | Loan Amount |
|---|---|---|---|
| Open | Winstead Larry L | $207,000 |
Source: Public Records
Tax History Compared to Growth
Tax History
| Year | Tax Paid | Tax Assessment Tax Assessment Total Assessment is a certain percentage of the fair market value that is determined by local assessors to be the total taxable value of land and additions on the property. | Land | Improvement |
|---|---|---|---|---|
| 2024 | $642 | $36,450 | $7,800 | $28,650 |
| 2023 | $642 | $36,450 | $0 | $0 |
| 2022 | $1,152 | $36,450 | $7,800 | $28,650 |
| 2021 | $1,152 | $36,450 | $7,800 | $28,650 |
| 2020 | $1,151 | $36,450 | $7,800 | $28,650 |
| 2019 | $1,150 | $33,825 | $8,300 | $25,525 |
| 2018 | $1,066 | $33,825 | $8,300 | $25,525 |
| 2017 | $1,049 | $33,825 | $8,300 | $25,525 |
| 2016 | $1,001 | $33,825 | $8,300 | $25,525 |
| 2015 | $932 | $33,825 | $8,300 | $25,525 |
| 2014 | -- | $33,825 | $8,300 | $25,525 |
| 2013 | -- | $37,625 | $0 | $0 |
Source: Public Records
Map
Nearby Homes
- 458 Laurel St
- 808 Gaston St
- 1670 Oak St
- 0 Russell Cir
- 1205 Ledford Ave
- 000 Bacon Ln
- 1200 Liberty Hall Dr
- 460 Ash St
- 1932 Eastern Ave
- 411 Ash St
- 0 Joe Hall Rd Unit 703714
- 216 Laurel St
- 518 W Hillcrest Dr
- 525 S Liberty Hill Rd
- 0 S Liberty Hill Rd Unit 703697
- 819 Choctaw St
- 828 Overlook Dr
- 816 Choctaw St
- 915 Forgey Ave
- 1710 Morningside Dr
- 761 Pritchard Dr
- 757 Pritchard Dr
- 764 Pritchard Dr
- 749 Pritchard Dr
- 750 Pritchard Dr
- 746 Pritchard Dr
- 741 Pritchard Dr
- 742 Pritchard Dr Unit S/D Arnold Hills
- 742 Pritchard Dr
- 849 Spruce St
- 837 Spruce St
- 853 Spruce St
- 731 Pritchard Dr
- 736 Pritchard Dr
- 775 Spruce St
- 723 Pritchard Dr
- 722 Pritchard Dr
- 1955 Collegewood Dr
- 761 Spruce St
- 842 Spruce St