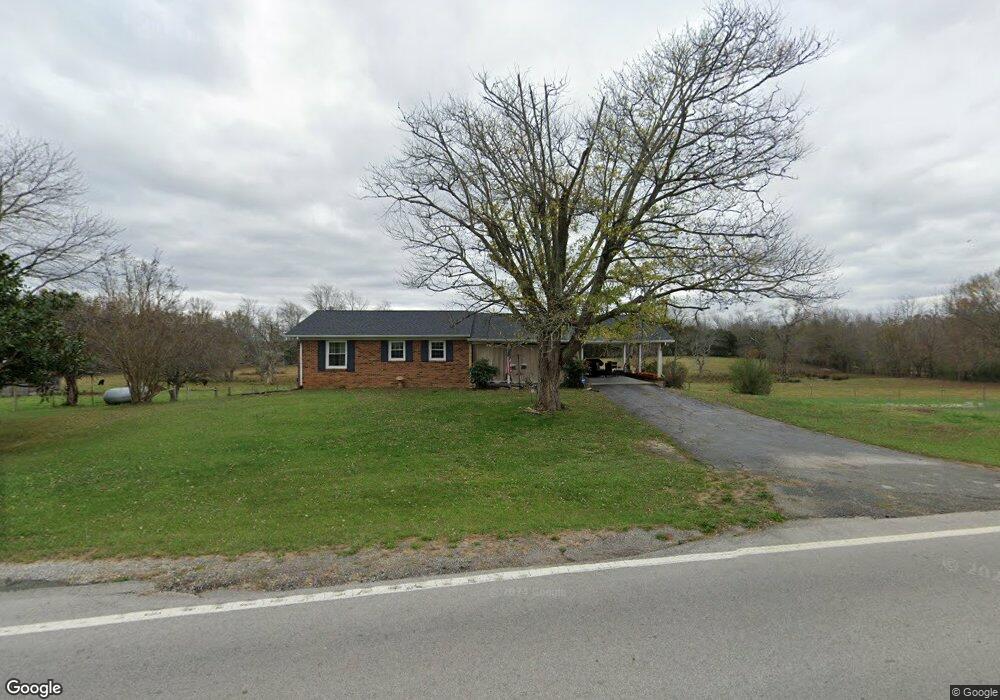
7653 Hilham Rd Cookeville, TN 38506
Estimated Value: $202,956 - $276,000
--
Bed
2
Baths
1,250
Sq Ft
$193/Sq Ft
Est. Value
About This Home
This home is located at 7653 Hilham Rd, Cookeville, TN 38506 and is currently estimated at $241,739, approximately $193 per square foot. 7653 Hilham Rd is a home located in Putnam County with nearby schools including Cookeville High School, Algood Middle School, and Algood Elementary School.
Ownership History
Date
Name
Owned For
Owner Type
Purchase Details
Closed on
Oct 11, 2023
Sold by
Mccowan Floyd
Bought by
Neely Robin
Current Estimated Value
Purchase Details
Closed on
Mar 24, 2021
Sold by
Yates William Leo and Yates Patsy Anne
Bought by
Mccormick Bruce Scott and Mccormick Brandy Logan
Purchase Details
Closed on
Aug 25, 2005
Sold by
Sylvia Cumby
Bought by
Cumby Charles S
Purchase Details
Closed on
Jun 29, 2005
Sold by
Cumby Sylvia %Charles S
Bought by
Cumby Charles S
Purchase Details
Closed on
Jul 16, 1999
Sold by
Cumby Charles S
Bought by
Sylvia Cumby
Purchase Details
Closed on
Jul 20, 1998
Sold by
Sylvia Cumby
Bought by
Cumby Charles S
Purchase Details
Closed on
Oct 21, 1991
Bought by
Cumby Sylvia
Purchase Details
Closed on
Jun 4, 1985
Purchase Details
Closed on
Jul 8, 1967
Bought by
Cumby John Scott and Cumby Sylvia
Create a Home Valuation Report for This Property
The Home Valuation Report is an in-depth analysis detailing your home's value as well as a comparison with similar homes in the area
Home Values in the Area
Average Home Value in this Area
Purchase History
| Date | Buyer | Sale Price | Title Company |
|---|---|---|---|
| Neely Robin | -- | None Listed On Document | |
| Mccormick Bruce Scott | $160,000 | None Available | |
| Cumby Charles S | -- | -- | |
| Cumby Charles S | -- | -- | |
| Sylvia Cumby | -- | -- | |
| Cumby Charles S | -- | -- | |
| Cumby Sylvia | -- | -- | |
| -- | -- | -- | |
| Cumby John Scott | -- | -- |
Source: Public Records
Tax History Compared to Growth
Tax History
| Year | Tax Paid | Tax Assessment Tax Assessment Total Assessment is a certain percentage of the fair market value that is determined by local assessors to be the total taxable value of land and additions on the property. | Land | Improvement |
|---|---|---|---|---|
| 2024 | $734 | $27,600 | $4,000 | $23,600 |
| 2023 | $734 | $27,600 | $4,000 | $23,600 |
| 2022 | $682 | $27,600 | $4,000 | $23,600 |
| 2021 | $682 | $27,600 | $4,000 | $23,600 |
| 2020 | $282 | $27,600 | $4,000 | $23,600 |
| 2019 | $282 | $9,650 | $3,250 | $6,400 |
| 2018 | $263 | $9,650 | $3,250 | $6,400 |
| 2017 | $263 | $9,650 | $3,250 | $6,400 |
| 2016 | $263 | $9,650 | $3,250 | $6,400 |
| 2015 | $271 | $9,650 | $3,250 | $6,400 |
| 2014 | $275 | $9,804 | $0 | $0 |
Source: Public Records
Map
Nearby Homes