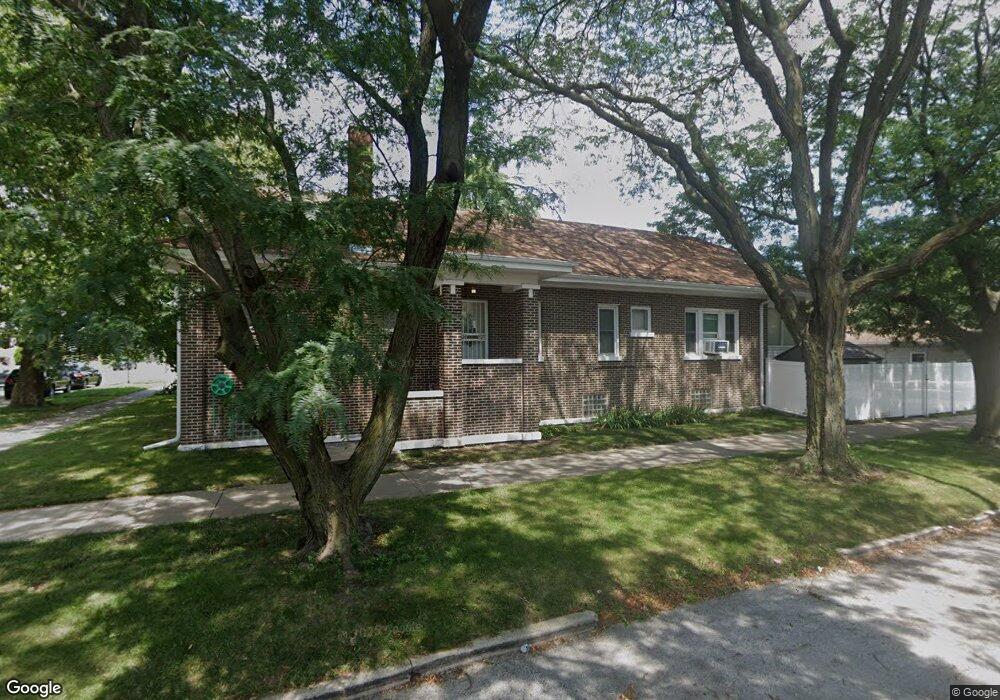
7659 S Oglesby Ave Chicago, IL 60649
South Shore NeighborhoodEstimated Value: $200,958 - $298,000
3
Beds
3
Baths
1,691
Sq Ft
$152/Sq Ft
Est. Value
About This Home
This home is located at 7659 S Oglesby Ave, Chicago, IL 60649 and is currently estimated at $256,990, approximately $151 per square foot. 7659 S Oglesby Ave is a home located in Cook County with nearby schools including Bradwell Community Arts & Sci Elementary School.
Ownership History
Date
Name
Owned For
Owner Type
Purchase Details
Closed on
Dec 9, 2005
Sold by
Crutcher John and Crutcher Shirley
Bought by
Crutcher John D
Current Estimated Value
Home Financials for this Owner
Home Financials are based on the most recent Mortgage that was taken out on this home.
Original Mortgage
$176,610
Outstanding Balance
$99,926
Interest Rate
6.48%
Mortgage Type
FHA
Estimated Equity
$157,064
Purchase Details
Closed on
Jan 29, 2003
Sold by
Allen Sharon Griffin
Bought by
Crutcher John and Crutcher Shirley
Home Financials for this Owner
Home Financials are based on the most recent Mortgage that was taken out on this home.
Original Mortgage
$139,040
Interest Rate
6.13%
Purchase Details
Closed on
May 17, 1997
Sold by
Griffin Allen Bourelly Sheila Griffin and Griffin Allen Coates Selma
Bought by
Allen Sharon Griffin
Home Financials for this Owner
Home Financials are based on the most recent Mortgage that was taken out on this home.
Original Mortgage
$67,500
Interest Rate
10.74%
Create a Home Valuation Report for This Property
The Home Valuation Report is an in-depth analysis detailing your home's value as well as a comparison with similar homes in the area
Home Values in the Area
Average Home Value in this Area
Purchase History
| Date | Buyer | Sale Price | Title Company |
|---|---|---|---|
| Crutcher John D | -- | 1St American Title | |
| Crutcher John | -- | Chicago Title Insurance Co | |
| Allen Sharon Griffin | -- | -- |
Source: Public Records
Mortgage History
| Date | Status | Borrower | Loan Amount |
|---|---|---|---|
| Open | Crutcher John D | $176,610 | |
| Closed | Crutcher John | $139,040 | |
| Previous Owner | Allen Sharon Griffin | $67,500 |
Source: Public Records
Tax History Compared to Growth
Tax History
| Year | Tax Paid | Tax Assessment Tax Assessment Total Assessment is a certain percentage of the fair market value that is determined by local assessors to be the total taxable value of land and additions on the property. | Land | Improvement |
|---|---|---|---|---|
| 2024 | $2,050 | $14,400 | $3,883 | $10,517 |
| 2023 | $1,970 | $13,000 | $6,471 | $6,529 |
| 2022 | $1,970 | $13,000 | $6,471 | $6,529 |
| 2021 | $1,944 | $12,999 | $6,471 | $6,528 |
| 2020 | $2,902 | $16,127 | $4,659 | $11,468 |
| 2019 | $2,911 | $17,919 | $4,659 | $13,260 |
| 2018 | $2,861 | $17,919 | $4,659 | $13,260 |
| 2017 | $3,019 | $17,399 | $4,141 | $13,258 |
| 2016 | $2,985 | $17,399 | $4,141 | $13,258 |
| 2015 | $2,708 | $17,399 | $4,141 | $13,258 |
| 2014 | $2,491 | $15,994 | $3,623 | $12,371 |
| 2013 | $2,431 | $15,994 | $3,623 | $12,371 |
Source: Public Records
Map
Nearby Homes
- 7715 S Oglesby Ave
- 7721 S Phillips Ave
- 7733 S Luella Ave
- 7745 S Luella Ave
- 7617 S Crandon Ave
- 7816 S Phillips Ave
- 7834 S Oglesby Ave
- 7628 S Essex Ave Unit 1N
- 7723 S Paxton Ave
- 7845 S Yates Blvd
- 7825 S Phillips Ave
- 7643 S Paxton Ave
- 7637 S Essex Ave
- 7725 S Kingston Ave
- 7623 S Essex Ave
- 7915 S Phillips Ave
- 7833 S Kingston Ave
- 7642 S Merrill Ave
- 7839 S Kingston Ave
- 7727 S Colfax Ave
- 7653 S Oglesby Ave
- 7649 S Oglesby Ave
- 7701 S Oglesby Ave
- 7643 S Oglesby Ave
- 7705 S Oglesby Ave
- 7654 S Yates Blvd
- 7650 S Yates Blvd
- 7656 S Yates Blvd
- 7648 S Yates Blvd
- 7641 S Oglesby Ave
- 7700 S Yates Blvd
- 7709 S Oglesby Ave
- 7642 S Yates Blvd
- 7658 S Oglesby Ave
- 7654 S Oglesby Ave
- 7650 S Oglesby Ave
- 7635 S Oglesby Ave
- 7648 S Oglesby Ave
- 7711 S Oglesby Ave
- 7700 S Oglesby Ave