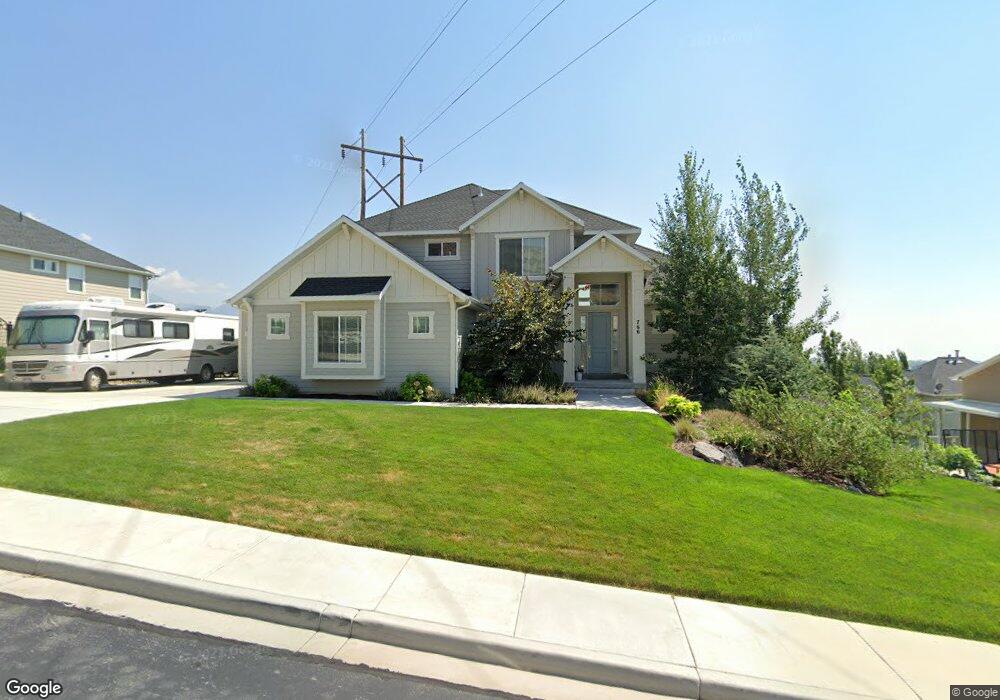
766 E 680 N Lindon, UT 84042
Estimated Value: $741,000 - $1,065,000
4
Beds
4
Baths
4,478
Sq Ft
$213/Sq Ft
Est. Value
About This Home
This home is located at 766 E 680 N, Lindon, UT 84042 and is currently estimated at $951,689, approximately $212 per square foot. 766 E 680 N is a home located in Utah County with nearby schools including Lindon Elementary School, Oak Canyon Junior High School, and Pleasant Grove High School.
Ownership History
Date
Name
Owned For
Owner Type
Purchase Details
Closed on
Jan 14, 2025
Sold by
Mcintyre Dennis and Mcintyre Jennifer
Bought by
Dennis And Jennifer Mcintyre Living Trust and Mcintyre
Current Estimated Value
Purchase Details
Closed on
Mar 23, 2016
Sold by
Moore Emily
Bought by
Mcintyre Dennis and Mcintyre Jennifer
Home Financials for this Owner
Home Financials are based on the most recent Mortgage that was taken out on this home.
Original Mortgage
$417,000
Interest Rate
3.65%
Mortgage Type
New Conventional
Purchase Details
Closed on
Apr 7, 2015
Sold by
Black Scot Development Lc
Bought by
Moore Emily
Create a Home Valuation Report for This Property
The Home Valuation Report is an in-depth analysis detailing your home's value as well as a comparison with similar homes in the area
Home Values in the Area
Average Home Value in this Area
Purchase History
| Date | Buyer | Sale Price | Title Company |
|---|---|---|---|
| Dennis And Jennifer Mcintyre Living Trust | -- | None Listed On Document | |
| Mcintyre Dennis | -- | Inwest Title Orem | |
| Moore Emily | -- | Inwest Title |
Source: Public Records
Mortgage History
| Date | Status | Borrower | Loan Amount |
|---|---|---|---|
| Previous Owner | Mcintyre Dennis | $417,000 |
Source: Public Records
Tax History
| Year | Tax Paid | Tax Assessment Tax Assessment Total Assessment is a certain percentage of the fair market value that is determined by local assessors to be the total taxable value of land and additions on the property. | Land | Improvement |
|---|---|---|---|---|
| 2025 | $6,913 | $916,100 | $270,900 | $645,200 |
| 2024 | $6,913 | $852,200 | $0 | $0 |
| 2023 | $6,558 | $868,400 | $0 | $0 |
| 2022 | $6,455 | $825,600 | $275,000 | $550,600 |
| 2021 | $3,437 | $662,800 | $211,500 | $451,300 |
| 2020 | $3,298 | $626,200 | $192,300 | $433,900 |
| 2019 | $3,085 | $611,100 | $177,200 | $433,900 |
| 2018 | $2,606 | $486,700 | $162,200 | $324,500 |
| 2017 | $2,420 | $242,330 | $0 | $0 |
| 2016 | $2,567 | $237,710 | $0 | $0 |
| 2015 | $1,675 | $146,700 | $0 | $0 |
Source: Public Records
Map
Nearby Homes
Your Personal Tour Guide
Ask me questions while you tour the home.