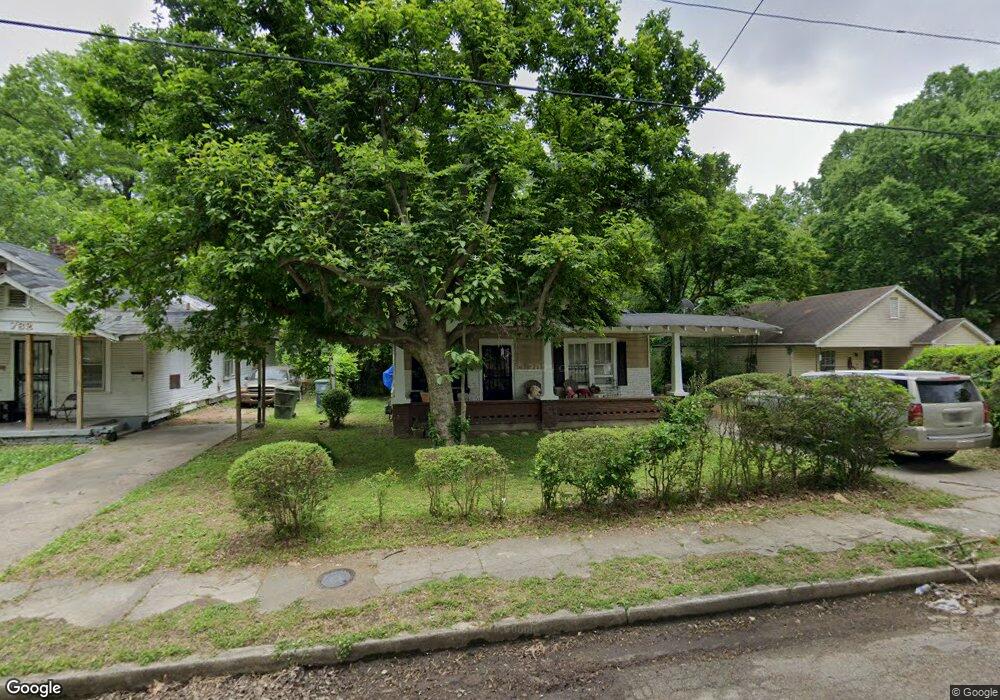
766 Goodwyn St Memphis, TN 38111
Orange Mound NeighborhoodEstimated Value: $62,232 - $88,000
3
Beds
1
Bath
1,112
Sq Ft
$69/Sq Ft
Est. Value
About This Home
This home is located at 766 Goodwyn St, Memphis, TN 38111 and is currently estimated at $76,558, approximately $68 per square foot. 766 Goodwyn St is a home located in Shelby County with nearby schools including Sherwood Middle, Melrose High School, and Hanley School - Elementary.
Ownership History
Date
Name
Owned For
Owner Type
Purchase Details
Closed on
Sep 26, 2002
Sold by
Richardson Allen
Bought by
Reed Michael E
Current Estimated Value
Home Financials for this Owner
Home Financials are based on the most recent Mortgage that was taken out on this home.
Original Mortgage
$110,000
Interest Rate
6.18%
Purchase Details
Closed on
Oct 27, 1999
Sold by
Union Planters Bank
Bought by
Richardson Allen
Purchase Details
Closed on
Feb 25, 1999
Sold by
Key Juanita D
Bought by
Union Planters Bank National Assn
Purchase Details
Closed on
Mar 11, 1998
Sold by
Brookfield Prop Inc
Bought by
Key Juanita D
Home Financials for this Owner
Home Financials are based on the most recent Mortgage that was taken out on this home.
Original Mortgage
$40,000
Interest Rate
7.07%
Purchase Details
Closed on
Dec 14, 1994
Bought by
Brookfield Prop Inc
Create a Home Valuation Report for This Property
The Home Valuation Report is an in-depth analysis detailing your home's value as well as a comparison with similar homes in the area
Home Values in the Area
Average Home Value in this Area
Purchase History
| Date | Buyer | Sale Price | Title Company |
|---|---|---|---|
| Reed Michael E | $116,618 | -- | |
| Richardson Allen | $24,750 | -- | |
| Union Planters Bank National Assn | $42,000 | -- | |
| Key Juanita D | $47,900 | -- | |
| Brookfield Prop Inc | $10,366 | -- |
Source: Public Records
Mortgage History
| Date | Status | Borrower | Loan Amount |
|---|---|---|---|
| Closed | Reed Michael E | $110,000 | |
| Previous Owner | Key Juanita D | $40,000 | |
| Closed | Key Juanita D | $10,000 | |
| Closed | Reed Michael E | $20,000 |
Source: Public Records
Tax History Compared to Growth
Tax History
| Year | Tax Paid | Tax Assessment Tax Assessment Total Assessment is a certain percentage of the fair market value that is determined by local assessors to be the total taxable value of land and additions on the property. | Land | Improvement |
|---|---|---|---|---|
| 2025 | $282 | $12,500 | $1,625 | $10,875 |
| 2024 | $282 | $8,325 | $750 | $7,575 |
| 2023 | $507 | $8,325 | $750 | $7,575 |
| 2022 | $507 | $8,325 | $750 | $7,575 |
| 2021 | $513 | $8,325 | $750 | $7,575 |
| 2020 | $565 | $7,800 | $750 | $7,050 |
| 2019 | $565 | $7,800 | $750 | $7,050 |
| 2018 | $565 | $7,800 | $750 | $7,050 |
| 2017 | $321 | $7,800 | $750 | $7,050 |
| 2016 | $354 | $8,100 | $0 | $0 |
| 2014 | $354 | $8,100 | $0 | $0 |
Source: Public Records
Map
Nearby Homes