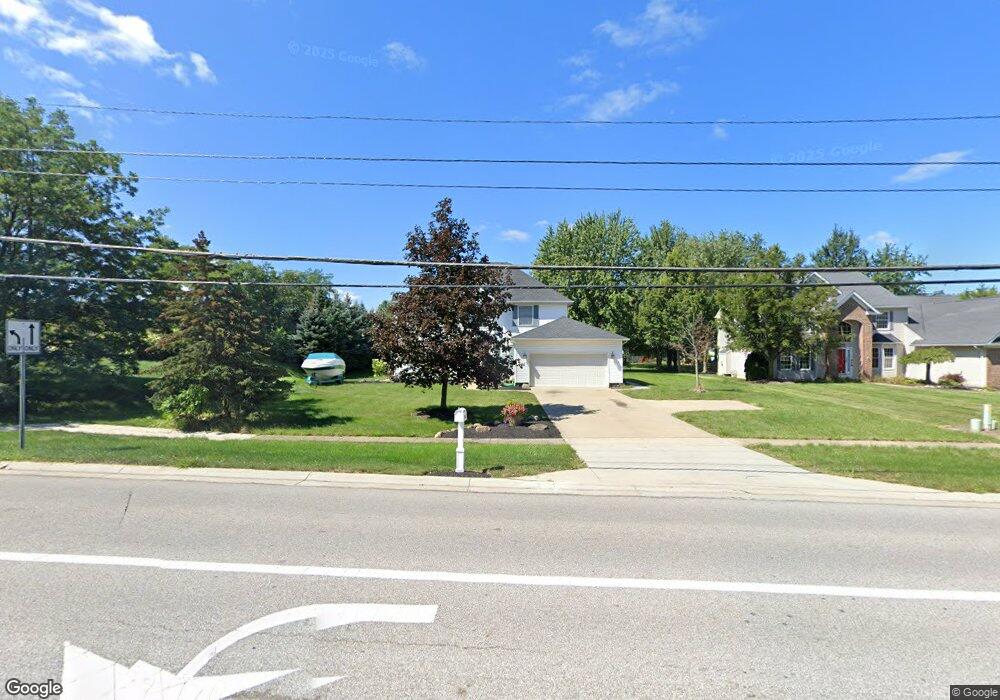
766 Lear Rd Avon Lake, OH 44012
Estimated Value: $474,000 - $530,000
4
Beds
3
Baths
2,157
Sq Ft
$232/Sq Ft
Est. Value
About This Home
This home is located at 766 Lear Rd, Avon Lake, OH 44012 and is currently estimated at $501,230, approximately $232 per square foot. 766 Lear Rd is a home located in Lorain County with nearby schools including Eastview Elementary School, Troy Intermediate Elementary School, and Learwood Middle School.
Ownership History
Date
Name
Owned For
Owner Type
Purchase Details
Closed on
Sep 11, 2014
Sold by
Parnell Mark F
Bought by
Cela Elderin
Current Estimated Value
Home Financials for this Owner
Home Financials are based on the most recent Mortgage that was taken out on this home.
Original Mortgage
$166,870
Outstanding Balance
$125,250
Interest Rate
3.62%
Mortgage Type
FHA
Estimated Equity
$375,980
Purchase Details
Closed on
Aug 15, 2002
Sold by
Gamer Construction Co
Bought by
Parnell Mark F
Home Financials for this Owner
Home Financials are based on the most recent Mortgage that was taken out on this home.
Original Mortgage
$181,600
Interest Rate
6.64%
Purchase Details
Closed on
Jul 22, 1999
Sold by
J & W Development Company and Butts Thomas
Bought by
Lapos Frank Paul
Create a Home Valuation Report for This Property
The Home Valuation Report is an in-depth analysis detailing your home's value as well as a comparison with similar homes in the area
Home Values in the Area
Average Home Value in this Area
Purchase History
| Date | Buyer | Sale Price | Title Company |
|---|---|---|---|
| Cela Elderin | $205,000 | None Available | |
| Parnell Mark F | $224,000 | Lorain County Title Co Inc | |
| Lapos Frank Paul | $45,000 | Lorain County Title Co Inc | |
| Gamer Construction Company Inc | $45,000 | Lorain County Title Co Inc |
Source: Public Records
Mortgage History
| Date | Status | Borrower | Loan Amount |
|---|---|---|---|
| Open | Cela Elderin | $166,870 | |
| Previous Owner | Parnell Mark F | $181,600 |
Source: Public Records
Tax History
| Year | Tax Paid | Tax Assessment Tax Assessment Total Assessment is a certain percentage of the fair market value that is determined by local assessors to be the total taxable value of land and additions on the property. | Land | Improvement |
|---|---|---|---|---|
| 2024 | $6,315 | $133,462 | $40,250 | $93,212 |
| 2023 | $5,147 | $96,765 | $23,709 | $73,056 |
| 2022 | $5,094 | $96,765 | $23,709 | $73,056 |
| 2021 | $5,082 | $96,765 | $23,709 | $73,056 |
| 2020 | $4,573 | $80,670 | $20,410 | $60,260 |
| 2019 | $4,549 | $80,670 | $20,410 | $60,260 |
| 2018 | $4,892 | $80,670 | $20,410 | $60,260 |
| 2017 | $5,221 | $84,960 | $19,200 | $65,760 |
| 2016 | $5,195 | $84,960 | $19,200 | $65,760 |
| 2015 | $5,220 | $84,960 | $19,200 | $65,760 |
| 2014 | $5,133 | $77,440 | $17,500 | $59,940 |
| 2013 | $5,172 | $77,440 | $17,500 | $59,940 |
Source: Public Records
Map
Nearby Homes
- 32041 Kossuth Dr
- 761 Rock Harbor
- 765 Rock Harbor
- 588 S Port Dr
- 560 Lear Rd
- 550 Lear Rd
- 611 Arborside Ln
- 643 Brownstone Cir
- 510 Port Side Dr
- 502 Port Side Dr
- 522 S Port Dr
- 670 Innisbrook Ln
- 31857 Avon Rd
- 604 Bar Harbor
- 531 Port Side Dr
- 32584 Royal Troon Dr
- 0 Avon Rd Unit 4372752
- 0 Avon Rd Unit 4372753
- 396 Creekside Dr
- 370 Lear Rd
- 764 Lear Rd
- 760 Lear Rd
- 32079 Country Club Dr
- 32089 Country Club Dr
- 32099 Country Club Dr
- 763 Lear Rd
- 763 Lear Rd Unit HL
- 759 Lear Rd
- 32109 Country Club Dr
- 753 Lear Rd
- 752 Lear Rd
- 32110 Augusta Dr
- 32119 Country Club Dr
- 32082 Country Club Dr
- 920 Nagel Rd
- 32118 Augusta Dr
- 750 Lear Rd
- 32127 Country Club Dr
- 750 Lear Country Club
- 32128 Country Club Dr
Your Personal Tour Guide
Ask me questions while you tour the home.