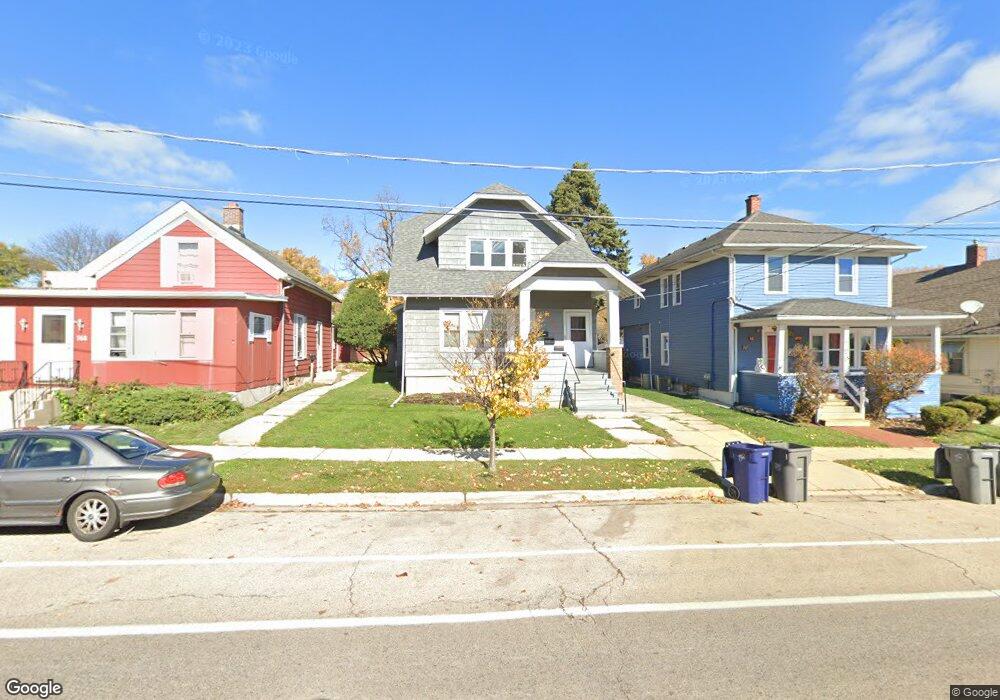
766 Walnut Ave Elgin, IL 60123
Near West Elgin NeighborhoodEstimated Value: $269,000 - $321,101
3
Beds
2
Baths
1,886
Sq Ft
$161/Sq Ft
Est. Value
About This Home
This home is located at 766 Walnut Ave, Elgin, IL 60123 and is currently estimated at $304,525, approximately $161 per square foot. 766 Walnut Ave is a home located in Kane County with nearby schools including Washington Elementary School, Abbott Middle School, and Larkin High School.
Ownership History
Date
Name
Owned For
Owner Type
Purchase Details
Closed on
Dec 16, 2024
Sold by
Noriega Jaime
Bought by
766 Walnut Jn Llc
Current Estimated Value
Home Financials for this Owner
Home Financials are based on the most recent Mortgage that was taken out on this home.
Original Mortgage
$200,000
Outstanding Balance
$198,442
Interest Rate
6.84%
Mortgage Type
New Conventional
Estimated Equity
$106,083
Purchase Details
Closed on
Apr 10, 2019
Sold by
Boehmer Judith A and Boehmer Keith L
Bought by
Noriega Jaime
Purchase Details
Closed on
Jan 20, 1995
Sold by
Boehmer James F
Bought by
Boehmer Judith A and Boehmer Keith L
Home Financials for this Owner
Home Financials are based on the most recent Mortgage that was taken out on this home.
Original Mortgage
$123,518
Interest Rate
9.2%
Mortgage Type
FHA
Create a Home Valuation Report for This Property
The Home Valuation Report is an in-depth analysis detailing your home's value as well as a comparison with similar homes in the area
Home Values in the Area
Average Home Value in this Area
Purchase History
| Date | Buyer | Sale Price | Title Company |
|---|---|---|---|
| 766 Walnut Jn Llc | -- | Fidelity National Title | |
| 766 Walnut Jn Llc | -- | Fidelity National Title | |
| Noriega Jaime | $150,000 | Attorneys Ttl Guaranty Fund | |
| Boehmer Judith A | $125,000 | Intercounty Title Co |
Source: Public Records
Mortgage History
| Date | Status | Borrower | Loan Amount |
|---|---|---|---|
| Open | 766 Walnut Jn Llc | $200,000 | |
| Closed | 766 Walnut Jn Llc | $200,000 | |
| Previous Owner | Boehmer Judith A | $123,518 |
Source: Public Records
Tax History
| Year | Tax Paid | Tax Assessment Tax Assessment Total Assessment is a certain percentage of the fair market value that is determined by local assessors to be the total taxable value of land and additions on the property. | Land | Improvement |
|---|---|---|---|---|
| 2024 | $7,754 | $96,890 | $15,901 | $80,989 |
| 2023 | $7,462 | $87,532 | $14,365 | $73,167 |
| 2022 | $6,921 | $79,814 | $13,098 | $66,716 |
| 2021 | $6,657 | $74,621 | $12,246 | $62,375 |
| 2020 | $6,497 | $71,238 | $11,691 | $59,547 |
| 2019 | $5,777 | $67,858 | $11,136 | $56,722 |
| 2018 | $5,737 | $63,927 | $10,491 | $53,436 |
| 2017 | $5,599 | $60,434 | $9,918 | $50,516 |
| 2016 | $5,340 | $56,066 | $9,201 | $46,865 |
| 2015 | -- | $51,390 | $8,434 | $42,956 |
| 2014 | -- | $50,756 | $8,330 | $42,426 |
| 2013 | -- | $52,095 | $8,550 | $43,545 |
Source: Public Records
Map
Nearby Homes
- 756 Walnut Ave
- 315 Vandalia St
- 761 South St
- 118 S Union St
- 118 Wilcox Ave
- 835 Oak St
- 400 Marguerite St
- 552 Walnut Ave
- 50 Sheridan St
- 532 South St
- 208 Moseley St
- 453 Orchard St
- 705 W Highland Ave
- 121 Monroe Ave
- 9 N Jackson St
- 96 S Crystal St
- 331 Orange St
- 1059 Larkin Ave
- 70 S Weston Ave
- 262 S Weston Ave
Your Personal Tour Guide
Ask me questions while you tour the home.