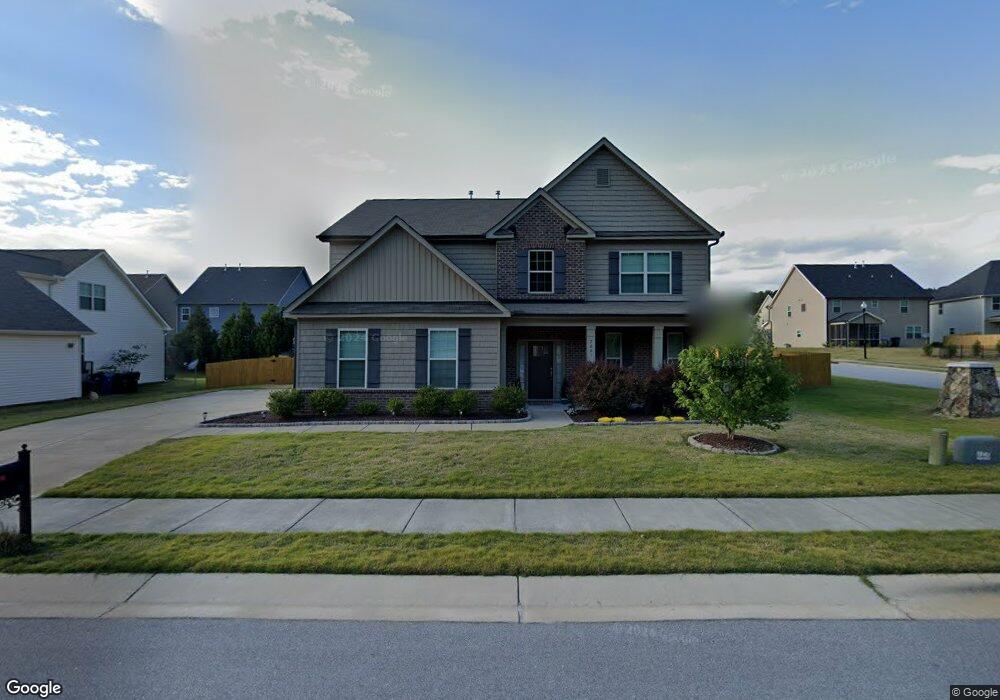
7661 Channery Way Unit LOT58 Raleigh, NC 27616
Northeast Raleigh NeighborhoodEstimated Value: $493,839 - $526,000
4
Beds
3
Baths
2,886
Sq Ft
$177/Sq Ft
Est. Value
About This Home
This home is located at 7661 Channery Way Unit LOT58, Raleigh, NC 27616 and is currently estimated at $512,210, approximately $177 per square foot. 7661 Channery Way Unit LOT58 is a home located in Wake County with nearby schools including Forestville Road Elementary School, Neuse River Middle School, and Knightdale High.
Ownership History
Date
Name
Owned For
Owner Type
Purchase Details
Closed on
Feb 19, 2020
Sold by
Morris Eddie W and Morris Billie C
Bought by
Webb Christopher Michael and Webb Britney Shae
Current Estimated Value
Home Financials for this Owner
Home Financials are based on the most recent Mortgage that was taken out on this home.
Original Mortgage
$289,000
Outstanding Balance
$255,889
Interest Rate
3.6%
Mortgage Type
New Conventional
Estimated Equity
$256,321
Purchase Details
Closed on
Aug 22, 2019
Sold by
Quiroz Gina
Bought by
Morris Eddie W and Morris Billic C
Purchase Details
Closed on
Dec 31, 2014
Sold by
D R Horton Inc
Bought by
Quiroz Gina
Home Financials for this Owner
Home Financials are based on the most recent Mortgage that was taken out on this home.
Original Mortgage
$298,955
Interest Rate
3.98%
Mortgage Type
Purchase Money Mortgage
Create a Home Valuation Report for This Property
The Home Valuation Report is an in-depth analysis detailing your home's value as well as a comparison with similar homes in the area
Home Values in the Area
Average Home Value in this Area
Purchase History
| Date | Buyer | Sale Price | Title Company |
|---|---|---|---|
| Webb Christopher Michael | $329,000 | None Available | |
| Morris Eddie W | -- | None Available | |
| Morris Eddie W | -- | None Listed On Document | |
| Quiroz Gina | $300,000 | None Available |
Source: Public Records
Mortgage History
| Date | Status | Borrower | Loan Amount |
|---|---|---|---|
| Open | Webb Christopher Michael | $289,000 | |
| Previous Owner | Quiroz Gina | $298,955 |
Source: Public Records
Tax History Compared to Growth
Tax History
| Year | Tax Paid | Tax Assessment Tax Assessment Total Assessment is a certain percentage of the fair market value that is determined by local assessors to be the total taxable value of land and additions on the property. | Land | Improvement |
|---|---|---|---|---|
| 2025 | $3,819 | $435,597 | $80,000 | $355,597 |
| 2024 | $3,803 | $435,597 | $80,000 | $355,597 |
| 2023 | $3,517 | $320,796 | $55,000 | $265,796 |
| 2022 | $3,268 | $320,796 | $55,000 | $265,796 |
| 2021 | $3,141 | $320,796 | $55,000 | $265,796 |
| 2020 | $3,084 | $320,796 | $55,000 | $265,796 |
| 2019 | $3,091 | $264,961 | $42,000 | $222,961 |
| 2018 | $2,915 | $264,961 | $42,000 | $222,961 |
| 2017 | $2,776 | $264,961 | $42,000 | $222,961 |
| 2016 | $2,719 | $264,961 | $42,000 | $222,961 |
| 2015 | $3,014 | $289,166 | $38,000 | $251,166 |
| 2014 | $373 | $38,000 | $38,000 | $0 |
Source: Public Records
Map
Nearby Homes
- 7661 Mapleshire Dr
- 7817 Elmshire Way
- 7636 Birchmoor Way
- 7727 Weathered Oak Way
- 7725 Weathered Oak Way
- 7535 Mapleshire Dr
- 7613 Oakberry Dr
- 7454 Randshire Way
- 7536 Oakberry Dr
- 4004 Mount Moran Rd
- 3932 Mount Moran Rd
- 7316 Birchshire Dr
- 3917 Mount Moran Rd
- 2108 Brilliant Dr
- LANSING - TRADITIONS Plan at Chapel Townes
- CARSON - TRADITIONS Plan at Chapel Townes
- DENVER - TRADITIONS Plan at Chapel Townes
- 7301 Vanover Dr
- 4208 Bluewing Rd
- 4317 Snow Goose Ct
- 7661 Channery Way
- 7657 Channery Way Unit LOT57
- 7657 Channery Way
- 7668 Birchmoor Way
- 7668 Birchmoor Way Unit LT60
- 7664 Birchmoor Way
- 7660 Birchmoor Way
- 7653 Channery Way Unit LT56
- 7653 Channery Way
- 7703 Cedarshire Ct Unit lot 813
- 7703 Cedarshire Ct
- 7656 Channery Way
- 7656 Birchmoor Way
- 7705 Cedarshire Ct
- 7705 Cedarshire Ct Unit 812
- 7649 Channery Way
- 7652 Birchmoor Way Unit LT64
- 7667 Birchmoor Way Unit LT98
- 7663 Birchmoor Way Unit LOT97
- 7659 Birchmoor Way