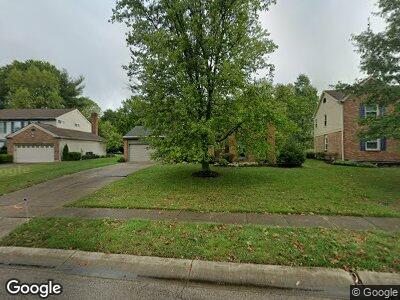
7668 Anderson Oaks Dr Cincinnati, OH 45255
Estimated Value: $417,000 - $477,000
3
Beds
3
Baths
1,812
Sq Ft
$241/Sq Ft
Est. Value
About This Home
This home is located at 7668 Anderson Oaks Dr, Cincinnati, OH 45255 and is currently estimated at $436,275, approximately $240 per square foot. 7668 Anderson Oaks Dr is a home located in Hamilton County with nearby schools including Sherwood Elementary School, Nagel Middle School, and Anderson High School.
Ownership History
Date
Name
Owned For
Owner Type
Purchase Details
Closed on
Aug 27, 2010
Sold by
Kreutzer Thomas R and Kruetzer Linda J
Bought by
Cone Stephen K and Cone Margaret D
Current Estimated Value
Home Financials for this Owner
Home Financials are based on the most recent Mortgage that was taken out on this home.
Original Mortgage
$160,000
Interest Rate
4.6%
Mortgage Type
New Conventional
Purchase Details
Closed on
Dec 21, 1993
Sold by
Trautmann Nicholas J and Trautmann Paula
Bought by
Kreutzer Thomas R and Kreutzer Linda J
Home Financials for this Owner
Home Financials are based on the most recent Mortgage that was taken out on this home.
Original Mortgage
$90,000
Interest Rate
7.16%
Create a Home Valuation Report for This Property
The Home Valuation Report is an in-depth analysis detailing your home's value as well as a comparison with similar homes in the area
Home Values in the Area
Average Home Value in this Area
Purchase History
| Date | Buyer | Sale Price | Title Company |
|---|---|---|---|
| Cone Stephen K | $225,000 | Attorney | |
| Kreutzer Thomas R | -- | -- |
Source: Public Records
Mortgage History
| Date | Status | Borrower | Loan Amount |
|---|---|---|---|
| Open | Cone Stephen K | $173,000 | |
| Closed | Cone Stephen K | $186,400 | |
| Closed | Cone Stephen K | $160,000 | |
| Previous Owner | Kreutzer Tom | $79,000 | |
| Previous Owner | Kreutzer Thomas R | $65,000 | |
| Previous Owner | Kreutzer Thomas R | $45,000 | |
| Previous Owner | Kreutzer Thomas R | $90,000 |
Source: Public Records
Tax History Compared to Growth
Tax History
| Year | Tax Paid | Tax Assessment Tax Assessment Total Assessment is a certain percentage of the fair market value that is determined by local assessors to be the total taxable value of land and additions on the property. | Land | Improvement |
|---|---|---|---|---|
| 2024 | $6,584 | $118,377 | $28,175 | $90,202 |
| 2023 | $6,308 | $118,377 | $28,175 | $90,202 |
| 2022 | $5,490 | $93,380 | $24,199 | $69,181 |
| 2021 | $5,349 | $93,380 | $24,199 | $69,181 |
| 2020 | $5,424 | $93,380 | $24,199 | $69,181 |
| 2019 | $5,213 | $82,639 | $21,417 | $61,222 |
| 2018 | $4,884 | $82,639 | $21,417 | $61,222 |
| 2017 | $4,599 | $82,639 | $21,417 | $61,222 |
| 2016 | $4,554 | $80,325 | $20,090 | $60,235 |
| 2015 | $4,430 | $80,325 | $20,090 | $60,235 |
| 2014 | $4,434 | $80,325 | $20,090 | $60,235 |
| 2013 | $4,100 | $78,751 | $19,695 | $59,056 |
Source: Public Records
Map
Nearby Homes
- 7633 Brannon Dr
- 1627 Cohasset Dr Unit 24
- 1629 Cohasset Dr
- 1353 Crotty Ct
- 1761 Emerald Glade Ln
- 1765 Emerald Glade Ln
- 7748 State Rd
- 7708 Stonehill Dr
- 7774 Heatherglen Dr
- 7949 Blackthorn Dr
- 1163 Witt Rd
- 8061 Pineterrace Dr
- 8083 Sacred Heart Ln
- 1994 Wittmeyer Dr
- 8121 Nagelwoods Dr
- 7279 Ticonderoga Ct
- 7053 Paddison Rd
- 8110 Sacred Heart Ln
- 8097 Pineterrace Dr
- 7974 Nagel Village Dr
- 7668 Anderson Oaks Dr
- 7676 Anderson Oaks Dr
- 7660 Anderson Oaks Dr
- 7684 Anderson Oaks Dr
- 7656 Anderson Oaks Dr
- 1466 Wolfangel Rd
- 7679 Anderson Oaks Dr
- 7692 Anderson Oaks Dr
- 1497 Burr Oak Dr
- 1512 Wolfangel Rd
- 1491 Burr Oak Dr
- 7687 Anderson Oaks Dr
- 7651 Benham Ct
- 7649 Benham Ct
- 7706 Anderson Oaks Dr
- 1444 Wolfangel Rd
- 7661 Benham Ct
- 1530 Wolfangel Rd
- 7695 Anderson Oaks Dr
- 1504 Cohasset Dr