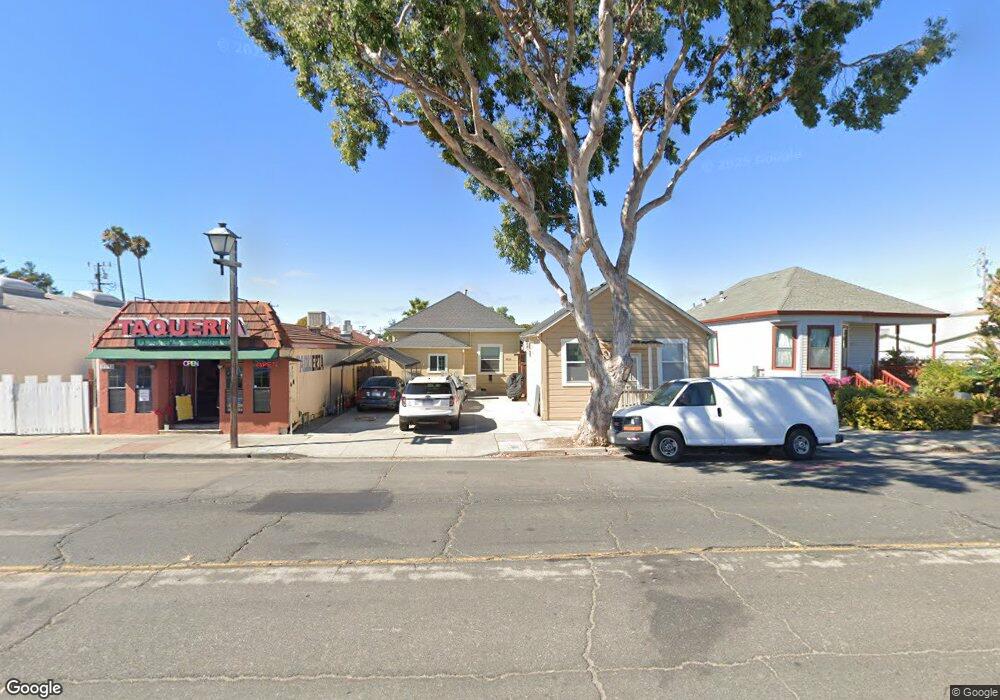
7669 Thornton Ave Newark, CA 94560
Estimated Value: $920,000 - $1,013,000
2
Beds
2
Baths
1,268
Sq Ft
$752/Sq Ft
Est. Value
About This Home
This home is located at 7669 Thornton Ave, Newark, CA 94560 and is currently estimated at $953,021, approximately $751 per square foot. 7669 Thornton Ave is a home located in Alameda County with nearby schools including August Schilling Elementary School, Newark Junior High School, and Newark Memorial High School.
Ownership History
Date
Name
Owned For
Owner Type
Purchase Details
Closed on
May 11, 2021
Sold by
Lovric Branko and Lovric Mara
Bought by
Lovric Branko and Lovric Mara
Current Estimated Value
Purchase Details
Closed on
May 16, 2000
Sold by
Baez Silvia
Bought by
Lovric Branko and Lovric Mare
Home Financials for this Owner
Home Financials are based on the most recent Mortgage that was taken out on this home.
Original Mortgage
$198,750
Outstanding Balance
$69,058
Interest Rate
8.22%
Mortgage Type
Commercial
Estimated Equity
$883,963
Purchase Details
Closed on
Dec 15, 1998
Sold by
Zaballos Lucas J and Zaballos Evelyn S
Bought by
Baez Silvia
Home Financials for this Owner
Home Financials are based on the most recent Mortgage that was taken out on this home.
Original Mortgage
$135,000
Interest Rate
6.86%
Mortgage Type
Seller Take Back
Create a Home Valuation Report for This Property
The Home Valuation Report is an in-depth analysis detailing your home's value as well as a comparison with similar homes in the area
Home Values in the Area
Average Home Value in this Area
Purchase History
| Date | Buyer | Sale Price | Title Company |
|---|---|---|---|
| Lovric Branko | -- | None Available | |
| Lovric Branko | $265,000 | First American Title Guarant | |
| Baez Silvia | $155,000 | First American Title Guarant |
Source: Public Records
Mortgage History
| Date | Status | Borrower | Loan Amount |
|---|---|---|---|
| Open | Lovric Branko | $198,750 | |
| Previous Owner | Baez Silvia | $135,000 |
Source: Public Records
Tax History
| Year | Tax Paid | Tax Assessment Tax Assessment Total Assessment is a certain percentage of the fair market value that is determined by local assessors to be the total taxable value of land and additions on the property. | Land | Improvement |
|---|---|---|---|---|
| 2025 | $6,053 | $407,275 | $122,182 | $285,093 |
| 2024 | $6,053 | $399,290 | $119,787 | $279,503 |
| 2023 | $5,855 | $391,462 | $117,438 | $274,024 |
| 2022 | $5,734 | $383,788 | $115,136 | $268,652 |
| 2021 | $5,601 | $376,264 | $112,879 | $263,385 |
| 2020 | $5,392 | $372,408 | $111,722 | $260,686 |
| 2019 | $5,325 | $365,108 | $109,532 | $255,576 |
| 2018 | $5,235 | $357,950 | $107,385 | $250,565 |
| 2017 | $5,100 | $350,933 | $105,280 | $245,653 |
| 2016 | $5,031 | $344,054 | $103,216 | $240,838 |
| 2015 | $5,013 | $338,887 | $101,666 | $237,221 |
| 2014 | $4,866 | $332,248 | $99,674 | $232,574 |
Source: Public Records
Map
Nearby Homes
- 6417/6433 Thornton Ave
- 36871 Locust St
- 7843 Railroad Ave
- 36563 Beutke Dr
- 37029 Olive St
- 6364 Noel Ave
- 8093 Del Monte Ave
- 6328 Zulmida Ave
- 8092 Olympic Ct
- 6169 Thornton Ave Unit B
- 36184 Toulouse St
- 6245 Thornton Ave
- 37541 Bay Crest Rd
- 37645 Bay Crest Rd
- 37471 Bay Crest Rd
- 37721 Bay Crest Rd
- 6252 Bennington Dr
- 37629 Breakers Rd
- 8550 Boardwalk Way
- 6048 Bellhaven Ave
Your Personal Tour Guide
Ask me questions while you tour the home.