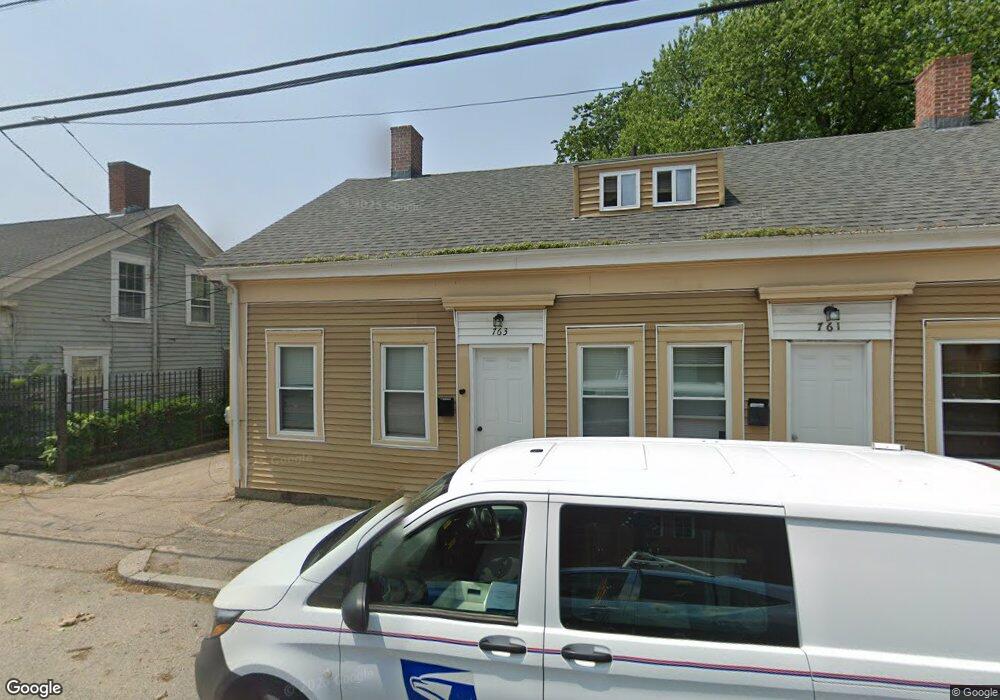
767 Dyer Ave Cranston, RI 02920
Village NeighborhoodEstimated Value: $357,000 - $443,000
4
Beds
2
Baths
1,663
Sq Ft
$235/Sq Ft
Est. Value
About This Home
This home is located at 767 Dyer Ave, Cranston, RI 02920 and is currently estimated at $390,393, approximately $234 per square foot. 767 Dyer Ave is a home located in Providence County with nearby schools including Arlington Elementary School, Hugh B. Bain Middle School, and Cranston High School East.
Ownership History
Date
Name
Owned For
Owner Type
Purchase Details
Closed on
Feb 8, 2022
Sold by
Gabhaltais Teaghlaigh Llc
Bought by
Cpw Truse Storage Llc
Current Estimated Value
Purchase Details
Closed on
Aug 9, 2018
Sold by
Cranston Print Works C
Bought by
Gabhaitais Teaghlaigh
Home Financials for this Owner
Home Financials are based on the most recent Mortgage that was taken out on this home.
Original Mortgage
$460,000
Interest Rate
4.5%
Mortgage Type
Purchase Money Mortgage
Create a Home Valuation Report for This Property
The Home Valuation Report is an in-depth analysis detailing your home's value as well as a comparison with similar homes in the area
Home Values in the Area
Average Home Value in this Area
Purchase History
| Date | Buyer | Sale Price | Title Company |
|---|---|---|---|
| Cpw Truse Storage Llc | $100,000 | None Available | |
| Gabhaitais Teaghlaigh | $575,000 | -- |
Source: Public Records
Mortgage History
| Date | Status | Borrower | Loan Amount |
|---|---|---|---|
| Previous Owner | Gabhaitais Teaghlaigh | $460,000 |
Source: Public Records
Tax History
| Year | Tax Paid | Tax Assessment Tax Assessment Total Assessment is a certain percentage of the fair market value that is determined by local assessors to be the total taxable value of land and additions on the property. | Land | Improvement |
|---|---|---|---|---|
| 2025 | $3,589 | $258,600 | $110,700 | $147,900 |
| 2024 | $3,520 | $258,600 | $110,700 | $147,900 |
| 2023 | $3,094 | $163,700 | $48,600 | $115,100 |
| 2022 | $3,030 | $163,700 | $48,600 | $115,100 |
| 2021 | $2,947 | $163,700 | $48,600 | $115,100 |
| 2020 | $2,702 | $130,100 | $38,200 | $91,900 |
| 2019 | $2,702 | $130,100 | $38,200 | $91,900 |
| 2018 | $3,386 | $166,900 | $38,200 | $128,700 |
| 2017 | $2,500 | $109,000 | $17,400 | $91,600 |
| 2016 | $2,447 | $109,000 | $17,400 | $91,600 |
| 2015 | $2,447 | $109,000 | $17,400 | $91,600 |
| 2014 | $2,675 | $117,100 | $17,400 | $99,700 |
Source: Public Records
Map
Nearby Homes
Your Personal Tour Guide
Ask me questions while you tour the home.