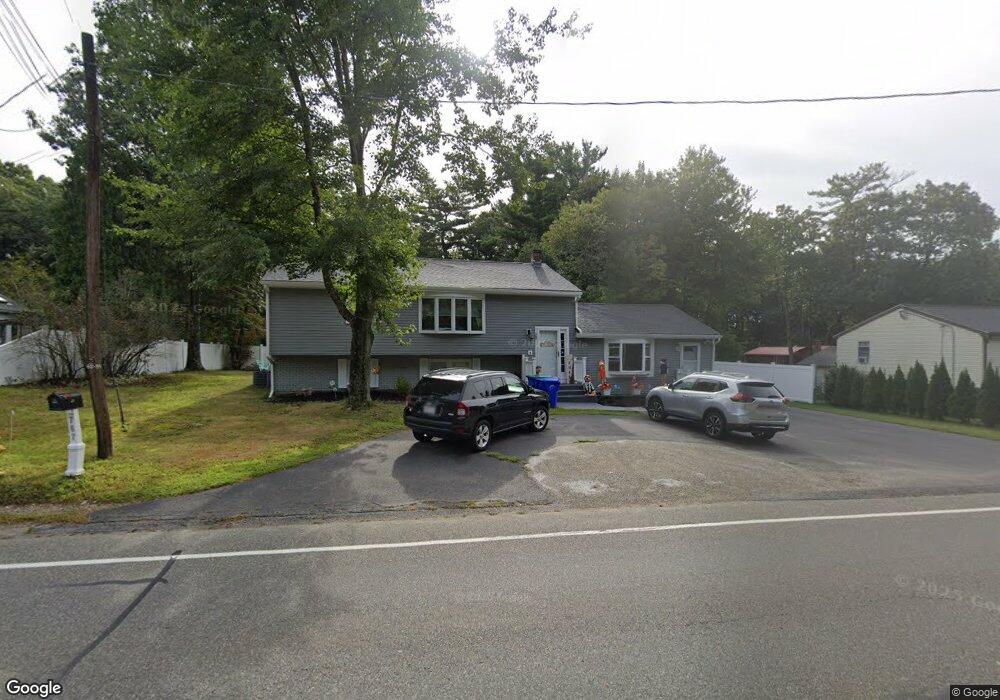
767 Hingham St Rockland, MA 02370
Estimated Value: $595,000 - $617,000
--
Bed
3
Baths
2,029
Sq Ft
$298/Sq Ft
Est. Value
About This Home
This home is located at 767 Hingham St, Rockland, MA 02370 and is currently estimated at $605,304, approximately $298 per square foot. 767 Hingham St is a home located in Plymouth County with nearby schools including Rockland Senior High School, South Shore Charter Public School, and The Accord School.
Ownership History
Date
Name
Owned For
Owner Type
Purchase Details
Closed on
Jul 1, 1993
Sold by
Orrall Thomas A and Orrall Karen E
Bought by
Mcgough David R and Mcgough Linda J
Current Estimated Value
Home Financials for this Owner
Home Financials are based on the most recent Mortgage that was taken out on this home.
Original Mortgage
$117,500
Interest Rate
7.46%
Mortgage Type
Purchase Money Mortgage
Create a Home Valuation Report for This Property
The Home Valuation Report is an in-depth analysis detailing your home's value as well as a comparison with similar homes in the area
Home Values in the Area
Average Home Value in this Area
Purchase History
| Date | Buyer | Sale Price | Title Company |
|---|---|---|---|
| Mcgough David R | $125,000 | -- |
Source: Public Records
Mortgage History
| Date | Status | Borrower | Loan Amount |
|---|---|---|---|
| Open | Mcgough David R | $25,000 | |
| Closed | Mcgough David R | $25,000 | |
| Closed | Mcgough David R | $15,000 | |
| Closed | Mcgough David R | $117,500 |
Source: Public Records
Tax History Compared to Growth
Tax History
| Year | Tax Paid | Tax Assessment Tax Assessment Total Assessment is a certain percentage of the fair market value that is determined by local assessors to be the total taxable value of land and additions on the property. | Land | Improvement |
|---|---|---|---|---|
| 2025 | $6,906 | $505,200 | $220,000 | $285,200 |
| 2024 | $6,705 | $476,900 | $207,600 | $269,300 |
| 2023 | $6,347 | $417,000 | $180,400 | $236,600 |
| 2022 | $5,988 | $357,500 | $156,800 | $200,700 |
| 2021 | $5,573 | $322,500 | $142,600 | $179,900 |
| 2020 | $5,378 | $307,300 | $135,800 | $171,500 |
| 2019 | $5,251 | $293,000 | $129,400 | $163,600 |
| 2018 | $5,016 | $275,300 | $129,400 | $145,900 |
| 2017 | $4,884 | $264,300 | $129,400 | $134,900 |
| 2016 | $4,702 | $254,300 | $124,400 | $129,900 |
| 2015 | $4,497 | $236,300 | $116,300 | $120,000 |
| 2014 | $4,249 | $231,700 | $114,000 | $117,700 |
Source: Public Records
Map
Nearby Homes
- 771 Hingham St
- 749 Hingham St
- 773 Hingham St
- 739 Hingham St
- 731 Hingham St
- 770 Hingham St
- 624 Forest St
- 791 Hingham St
- 729 Hingham St
- 616 Forest St
- 805 Hingham St
- 719 Hingham St
- 695 Hingham St
- 831 Hingham St
- 835 Hingham St
- 586 Forest St Unit 588
- 586 Forest St Unit 1
- 825 Hingham St
- 693 Hingham St
- 97 Weymouth St