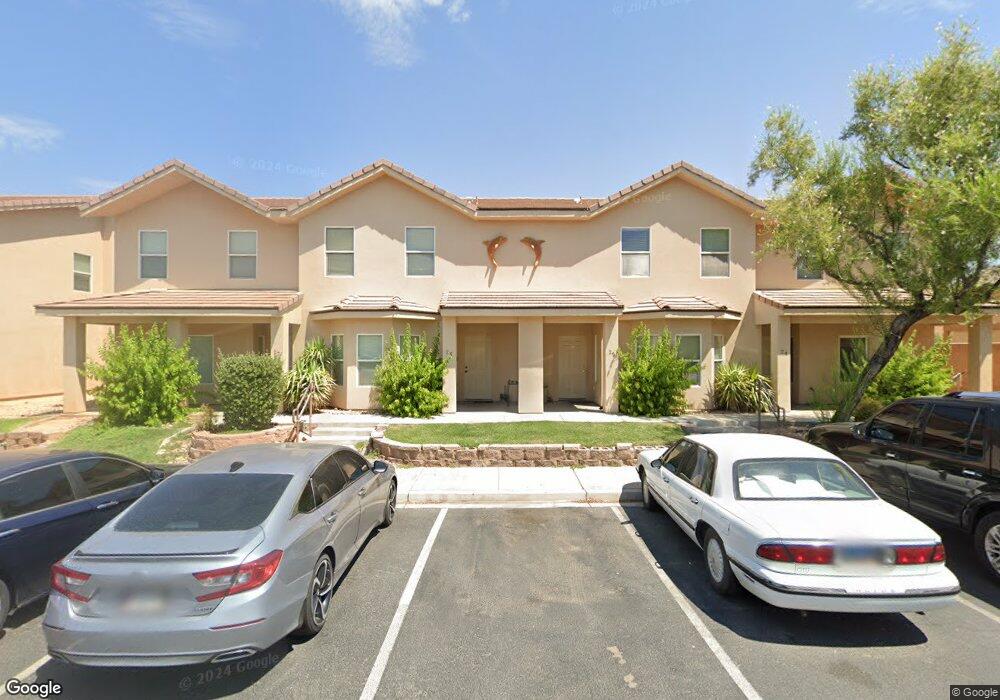
767 Moss Dr Unit 18 Mesquite, NV 89027
Estimated Value: $223,000 - $266,336
3
Beds
3
Baths
1,822
Sq Ft
$130/Sq Ft
Est. Value
About This Home
This home is located at 767 Moss Dr Unit 18, Mesquite, NV 89027 and is currently estimated at $236,584, approximately $129 per square foot. 767 Moss Dr Unit 18 is a home located in Clark County with nearby schools including Virgin Valley Elementary School, Charles Arthur Hughes Middle School, and Virgin Valley High School.
Ownership History
Date
Name
Owned For
Owner Type
Purchase Details
Closed on
Dec 8, 2020
Sold by
Chappell James M and Chappell Patricia M
Bought by
Perez Luis R
Current Estimated Value
Home Financials for this Owner
Home Financials are based on the most recent Mortgage that was taken out on this home.
Original Mortgage
$161,616
Outstanding Balance
$145,122
Interest Rate
2.8%
Mortgage Type
New Conventional
Estimated Equity
$91,462
Purchase Details
Closed on
Nov 13, 2012
Sold by
Home Savings Bank
Bought by
Chappell James M and Chappell Patricia M
Purchase Details
Closed on
Mar 31, 2012
Sold by
Winter Ridge Llc
Bought by
Home Savings Bank
Purchase Details
Closed on
Jun 2, 2011
Sold by
Allan Joseph P and Rawlings Scott
Bought by
Fitzpatrick Laura B
Create a Home Valuation Report for This Property
The Home Valuation Report is an in-depth analysis detailing your home's value as well as a comparison with similar homes in the area
Home Values in the Area
Average Home Value in this Area
Purchase History
| Date | Buyer | Sale Price | Title Company |
|---|---|---|---|
| Perez Luis R | $160,000 | Mesquite Title Company | |
| Chappell James M | $242,000 | Mesquite Title Co | |
| Home Savings Bank | $210,001 | None Available | |
| Fitzpatrick Laura B | -- | None Available |
Source: Public Records
Mortgage History
| Date | Status | Borrower | Loan Amount |
|---|---|---|---|
| Open | Perez Luis R | $28,650 | |
| Open | Perez Luis R | $161,616 |
Source: Public Records
Tax History Compared to Growth
Tax History
| Year | Tax Paid | Tax Assessment Tax Assessment Total Assessment is a certain percentage of the fair market value that is determined by local assessors to be the total taxable value of land and additions on the property. | Land | Improvement |
|---|---|---|---|---|
| 2025 | $1,003 | $90,332 | $17,150 | $73,182 |
| 2024 | $930 | $90,332 | $17,150 | $73,182 |
| 2023 | $930 | $80,608 | $14,350 | $66,258 |
| 2022 | $861 | $74,326 | $11,550 | $62,776 |
| 2021 | $797 | $53,892 | $11,550 | $42,342 |
| 2020 | $739 | $52,054 | $10,500 | $41,554 |
| 2019 | $692 | $45,573 | $9,100 | $36,473 |
| 2018 | $668 | $42,450 | $7,700 | $34,750 |
| 2017 | $1,076 | $38,793 | $6,650 | $32,143 |
| 2016 | $625 | $37,657 | $5,600 | $32,057 |
| 2015 | $625 | $34,970 | $5,600 | $29,370 |
| 2014 | $606 | $21,199 | $3,500 | $17,699 |
Source: Public Records
Map
Nearby Homes
- Beckett Plan at The Fields
- Weston Plan at The Fields
- Graham Plan at The Fields
- 375 Habib Way
- 254 Reber Dr
- 271 Concord Dr
- 777 2nd St S
- 364 Sam Way
- 294 Sam Way
- 287 Sam Way
- 463 Hagens Aly
- 162 Hermosa Way
- 228 Hiawatha Way
- 262 Thistle St
- 517 W Mesquite Blvd
- 871 Falcon Glenn Dr
- 844 Sagedell Rd
- 844 Glendale Rd
- 468 Apogee Crest St
- 479 Apogee Crest St
- 767 Moss Dr Unit 15
- 767 Moss Dr Unit 14
- 767 Moss Dr Unit 16
- 767 Moss Dr Unit 13
- 767 Moss Dr Unit 23
- 767 Moss Dr Unit 22
- 767 Moss Dr Unit 21
- 767 Moss Dr Unit 20
- 767 Moss Dr Unit 19
- 767 Moss Dr Unit 17
- 767 Moss Dr Unit 38
- 767 Moss Dr Unit 37
- 767 Moss Dr Unit 36
- 767 Moss Dr Unit 35
- 767 Moss Dr Unit 34
- 767 Moss Dr Unit 33
- 767 Moss Dr Unit 32
- 767 Moss Dr Unit 31
- 767 Moss Dr Unit 30
- 767 Moss Dr Unit 29