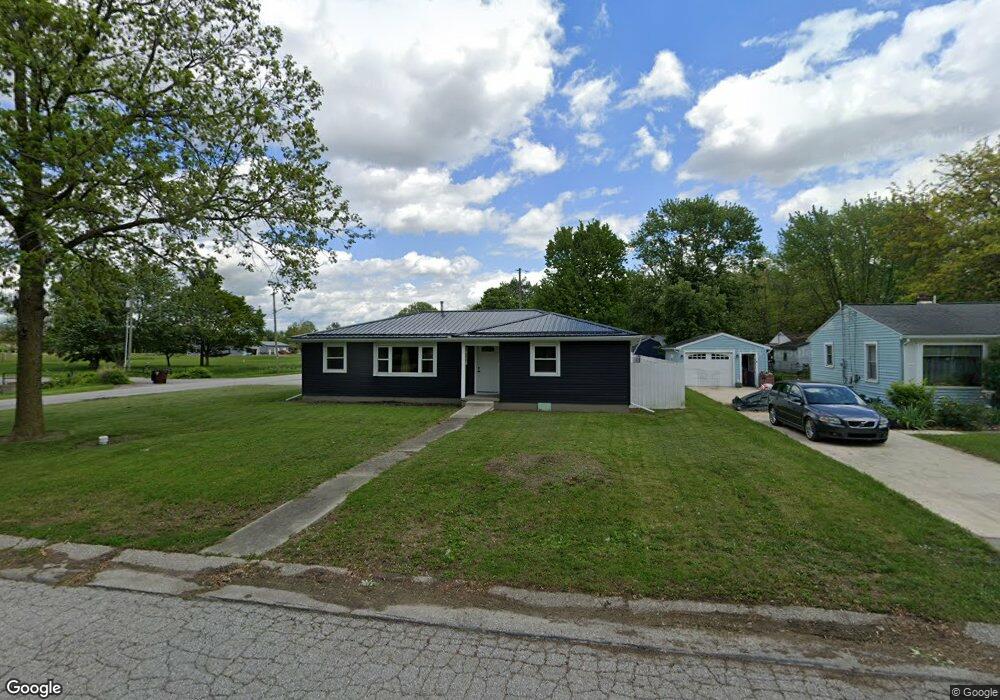
767 N Dix St Paulding, OH 45879
Estimated Value: $115,000 - $153,000
3
Beds
1
Bath
1,306
Sq Ft
$103/Sq Ft
Est. Value
About This Home
This home is located at 767 N Dix St, Paulding, OH 45879 and is currently estimated at $134,684, approximately $103 per square foot. 767 N Dix St is a home located in Paulding County with nearby schools including Paulding High School.
Ownership History
Date
Name
Owned For
Owner Type
Purchase Details
Closed on
Dec 30, 2019
Sold by
Griffiths Bonnie L
Bought by
Coughlin Eathon K
Current Estimated Value
Home Financials for this Owner
Home Financials are based on the most recent Mortgage that was taken out on this home.
Original Mortgage
$51,490
Outstanding Balance
$45,581
Interest Rate
3.7%
Mortgage Type
New Conventional
Estimated Equity
$89,103
Purchase Details
Closed on
Dec 14, 2016
Sold by
Griffiths Bonnie L
Bought by
Griffiths Bonnie L Trustee
Purchase Details
Closed on
Apr 19, 2007
Sold by
Lindsey Linda K and Lindsey Robert S
Bought by
Sutton Brandon A
Home Financials for this Owner
Home Financials are based on the most recent Mortgage that was taken out on this home.
Original Mortgage
$64,461
Interest Rate
6.2%
Mortgage Type
Purchase Money Mortgage
Create a Home Valuation Report for This Property
The Home Valuation Report is an in-depth analysis detailing your home's value as well as a comparison with similar homes in the area
Home Values in the Area
Average Home Value in this Area
Purchase History
| Date | Buyer | Sale Price | Title Company |
|---|---|---|---|
| Coughlin Eathon K | $54,200 | None Available | |
| Griffiths Bonnie L Trustee | -- | -- | |
| Sutton Brandon A | $65,000 | None Available |
Source: Public Records
Mortgage History
| Date | Status | Borrower | Loan Amount |
|---|---|---|---|
| Open | Coughlin Eathon K | $51,490 | |
| Previous Owner | Sutton Brandon A | $64,461 |
Source: Public Records
Tax History Compared to Growth
Tax History
| Year | Tax Paid | Tax Assessment Tax Assessment Total Assessment is a certain percentage of the fair market value that is determined by local assessors to be the total taxable value of land and additions on the property. | Land | Improvement |
|---|---|---|---|---|
| 2024 | $1,171 | $26,040 | $3,780 | $22,260 |
| 2023 | $1,171 | $26,040 | $3,780 | $22,260 |
| 2022 | $1,150 | $26,040 | $3,780 | $22,260 |
| 2021 | $1,036 | $21,080 | $2,840 | $18,240 |
| 2020 | $927 | $21,080 | $2,840 | $18,240 |
| 2019 | $959 | $19,430 | $2,840 | $16,590 |
| 2018 | $896 | $19,430 | $2,840 | $16,590 |
| 2017 | $897 | $19,430 | $2,840 | $16,590 |
| 2016 | $902 | $19,430 | $2,840 | $16,590 |
| 2015 | $907 | $19,820 | $2,840 | $16,980 |
| 2014 | $903 | $19,820 | $2,840 | $16,980 |
| 2013 | $977 | $19,820 | $2,840 | $16,980 |
Source: Public Records
Map
Nearby Homes
- 752 N Dix St
- Tract 2 - 0000 Ohio 111
- 0000 Ohio 111
- 907 Country View Dr
- 215 N Dewitt St
- 614 W Jackson St
- 606 Lincoln Ave
- 720 W Perry St
- 418 E Baldwin St
- 717 W Harrison St
- 720 W Wayne St
- 300 S Williams St
- 1045 Emerald Rd
- 1051 Emerald Rd
- 1065 Emerald Rd
- 13120 Helen St
- 0 Road 111
- 13678 Nancy St
- 825 Johnson Rd
- 12052 Dennis St
- 763 N Dix St
- 766 Woodring Ave
- 762 Woodring Ave
- 753 N Dix St
- 770 N Dix St
- 601 W Garfield Ave
- 756 Woodring Ave
- 762 N Dix St
- 751 N Dix St
- 754 N Dix St
- 750 Woodring Ave
- 745 N Dix St
- 757 Woodring Ave
- 746 Woodring Ave
- 755 Woodring Ave
- 743 N Dix St
- 747 Woodring Ave
- 744 N Dix St
- 745 Woodring Ave
- 737 N Dix St