
Seller's Agent in 2026
Steven Douglass
Comey & Shepherd
(513) 225-5090
2 in this area
127 Total Sales
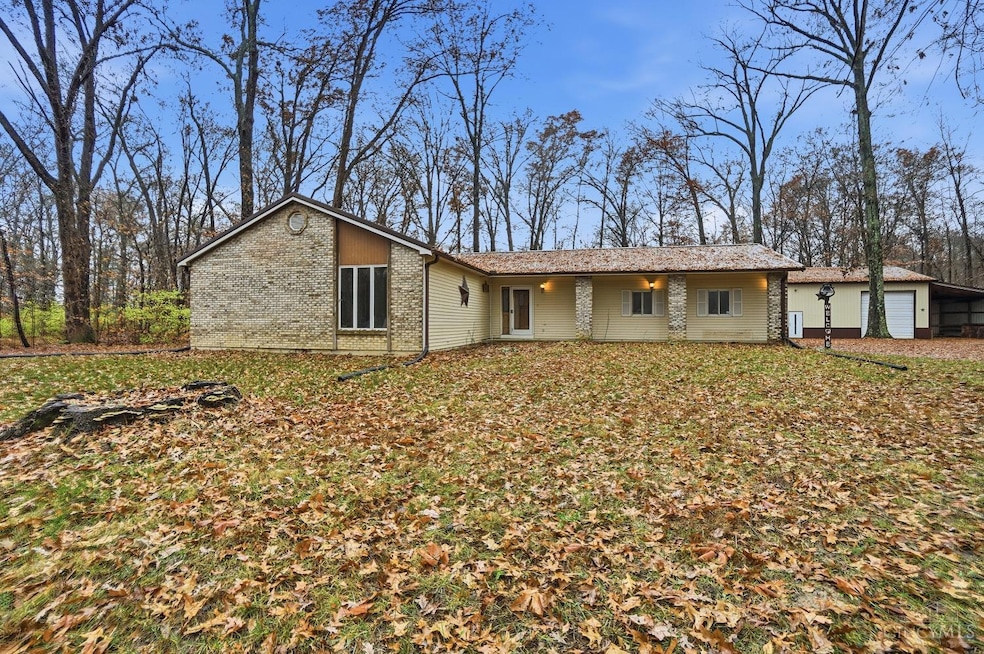
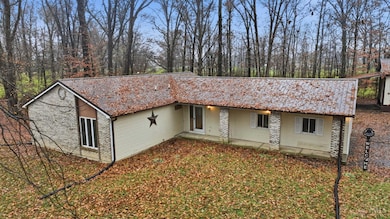
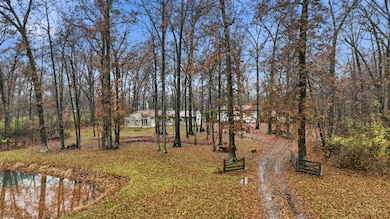
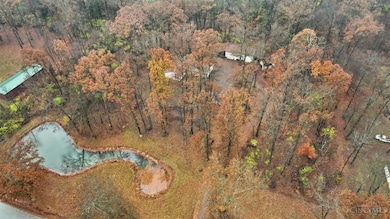
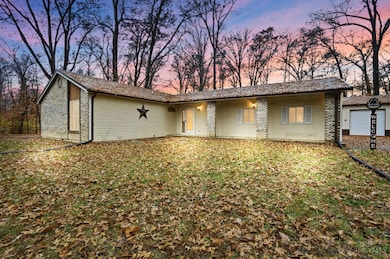
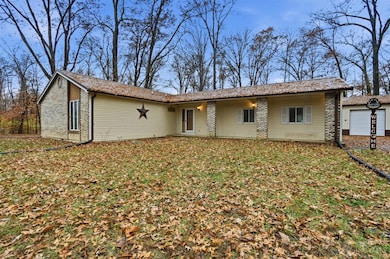
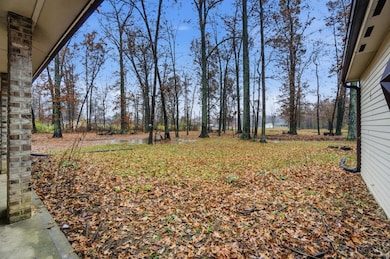
Prepare to be impressed! Spacious beautiful 3 bed, 2 bath ranch with full basement sits on 5 breathtaking acres in Little Miami Schools! Complete with a serene pond, peaceful creek, & gorgeous wooded backdrop. The updated kitchen shines with butcher block counters, white shaker cabinets, and SS appliances. All of this goes perfectly with fresh paint throughout and 2 cozy wood-burning fireplaces (1 in living room, 1 in basement). Enjoy peace of mind with a newer metal roof with gutter guards, newer furnace, and AC. The wrap-around driveway leads to a spacious 2-car attached garage & an oversized 30x48 pole barn with 2-14x30 lean-tos ideal for projects, toys, or equipment. Less than 5 minutes from I-71 and tucked back off the road, this rare property offers privacy, tranquility, space, and modern comfort. Don't miss this one-of-a-kind retreat!
Last Agent to Sell the Property
Comey & Shepherd License #2017003973 Listed on: 11/26/2025
| Date | Type | Sale Price | Title Company |
|---|---|---|---|
| Warranty Deed | $427,200 | None Listed On Document | |
| Quit Claim Deed | -- | None Listed On Document | |
| Interfamily Deed Transfer | -- | None Available | |
| Warranty Deed | $155,000 | Technetitle | |
| Deed | $23,000 | -- | |
| Deed | $18,000 | -- |
| Date | Status | Loan Amount | Loan Type |
|---|---|---|---|
| Open | $405,840 | New Conventional | |
| Previous Owner | $137,500 | New Conventional | |
| Previous Owner | $124,000 | New Conventional |
| Date | Event | Price | List to Sale | Price per Sq Ft |
|---|---|---|---|---|
| 01/15/2026 01/15/26 | Sold | $427,200 | -5.1% | $274 / Sq Ft |
| 12/21/2025 12/21/25 | Pending | -- | -- | -- |
| 12/12/2025 12/12/25 | Price Changed | $450,000 | -2.2% | $288 / Sq Ft |
| 12/05/2025 12/05/25 | Price Changed | $460,000 | -3.2% | $295 / Sq Ft |
| 11/26/2025 11/26/25 | For Sale | $475,000 | -- | $304 / Sq Ft |
| Year | Tax Paid | Tax Assessment Tax Assessment Total Assessment is a certain percentage of the fair market value that is determined by local assessors to be the total taxable value of land and additions on the property. | Land | Improvement |
|---|---|---|---|---|
| 2025 | $5,075 | $115,570 | $48,720 | $66,850 |
| 2024 | $5,075 | $115,570 | $48,720 | $66,850 |
| 2023 | $4,351 | $88,931 | $29,704 | $59,227 |
| 2022 | $4,274 | $88,932 | $29,705 | $59,227 |
| 2021 | $4,095 | $88,932 | $29,705 | $59,227 |
| 2020 | $3,874 | $72,303 | $24,150 | $48,153 |
| 2019 | $3,558 | $69,293 | $24,150 | $45,143 |
| 2018 | $3,620 | $69,293 | $24,150 | $45,143 |
| 2017 | $3,273 | $62,517 | $20,426 | $42,091 |
| 2016 | $3,353 | $62,517 | $20,426 | $42,091 |
| 2015 | $3,358 | $62,517 | $20,426 | $42,091 |
| 2014 | $3,558 | $59,250 | $19,920 | $39,340 |
| 2013 | $3,507 | $68,400 | $21,350 | $47,050 |
Seller's Agent in 2026
Steven Douglass
Comey & Shepherd
(513) 225-5090
2 in this area
127 Total Sales
Seller Co-Listing Agent in 2026
Nichole Yockey
Comey & Shepherd
(513) 678-2890
2 in this area
96 Total Sales
Buyer's Agent in 2026
Andrew Tanen
Sibcy Cline
(513) 702-7081
1 in this area
52 Total Sales
Source: MLS of Greater Cincinnati (CincyMLS)
MLS Number: 1862177
APN: 14-29-400-016
Disclaimer: Certain information contained herein is derived from information provided by parties other than Homes.com. All information provided is deemed reliable, but is not guaranteed to be accurate and should be independently verified.
![]() The data relating to real estate for sale on this website comes in part from the Broker Reciprocity programs of the MLS of Greater Cincinnati, Inc.. Those listings held by brokerage firms other than Ten-X are marked with the Broker Reciprocity logo and house icon. The properties displayed may not be all of the properties available through Broker Reciprocity.
The data relating to real estate for sale on this website comes in part from the Broker Reciprocity programs of the MLS of Greater Cincinnati, Inc.. Those listings held by brokerage firms other than Ten-X are marked with the Broker Reciprocity logo and house icon. The properties displayed may not be all of the properties available through Broker Reciprocity.
IDX information is provided exclusively for personal, non-commercial use, and may not be used for any purpose other than to identify prospective properties consumers may be interested in purchasing.
Information is deemed reliable but not guaranteed.
Ten-X does not display the entire Cincinnati MLS Broker Reciprocity™ database on this web site. The listings of some real estate brokerage firms have been excluded.
Copyright 2026, MLS of Greater Cincinnati, Inc. All rights reserved
Ask me questions while you tour the home.