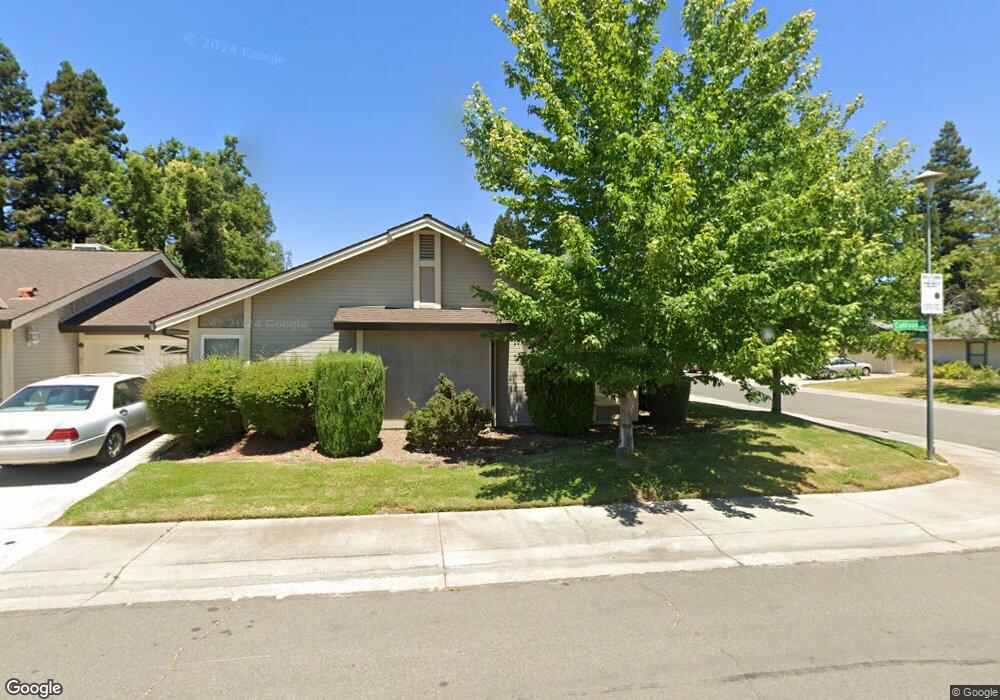
7670 Blackwater Way Sacramento, CA 95831
Pocket-Greenhaven NeighborhoodEstimated Value: $422,000 - $452,000
2
Beds
2
Baths
1,022
Sq Ft
$425/Sq Ft
Est. Value
About This Home
This home is located at 7670 Blackwater Way, Sacramento, CA 95831 and is currently estimated at $434,508, approximately $425 per square foot. 7670 Blackwater Way is a home located in Sacramento County with nearby schools including Matsuyama Elementary School, Sam Brannan Middle School, and John F. Kennedy High School.
Ownership History
Date
Name
Owned For
Owner Type
Purchase Details
Closed on
Nov 15, 2021
Sold by
Les Jang Living Trust
Bought by
Lkj Holdings Ca Llc
Current Estimated Value
Purchase Details
Closed on
Aug 22, 2006
Sold by
Jang Les
Bought by
Jang Les and Les Jang Living Trust
Purchase Details
Closed on
Jul 10, 2000
Sold by
Chu Kenny K and Chu Betsy P
Bought by
Jang Les and Owyang Lorraine
Home Financials for this Owner
Home Financials are based on the most recent Mortgage that was taken out on this home.
Original Mortgage
$116,100
Interest Rate
8.55%
Purchase Details
Closed on
Oct 14, 1998
Sold by
California Federal Bank Fsb
Bought by
Chu Kenny K and Chu Betsy P
Home Financials for this Owner
Home Financials are based on the most recent Mortgage that was taken out on this home.
Original Mortgage
$74,400
Interest Rate
6.79%
Purchase Details
Closed on
Jul 8, 1998
Sold by
Rodgers Jean C
Bought by
California Federal Bank Fsb
Create a Home Valuation Report for This Property
The Home Valuation Report is an in-depth analysis detailing your home's value as well as a comparison with similar homes in the area
Home Values in the Area
Average Home Value in this Area
Purchase History
| Date | Buyer | Sale Price | Title Company |
|---|---|---|---|
| Lkj Holdings Ca Llc | -- | Kyler Kohler Ostermiller & Sor | |
| Lkj Holdings Ca Llc | -- | None Available | |
| Jang Les | -- | None Available | |
| Jang Les | $129,000 | Stewart Title | |
| Chu Kenny K | $93,000 | Fidelity National Title Co | |
| California Federal Bank Fsb | $93,575 | -- |
Source: Public Records
Mortgage History
| Date | Status | Borrower | Loan Amount |
|---|---|---|---|
| Previous Owner | Jang Les | $116,100 | |
| Previous Owner | Chu Kenny K | $74,400 |
Source: Public Records
Tax History Compared to Growth
Tax History
| Year | Tax Paid | Tax Assessment Tax Assessment Total Assessment is a certain percentage of the fair market value that is determined by local assessors to be the total taxable value of land and additions on the property. | Land | Improvement |
|---|---|---|---|---|
| 2025 | $2,511 | $194,356 | $47,450 | $146,906 |
| 2024 | $2,511 | $190,546 | $46,520 | $144,026 |
| 2023 | $2,445 | $186,810 | $45,608 | $141,202 |
| 2022 | $2,418 | $183,148 | $44,714 | $138,434 |
| 2021 | $2,301 | $179,558 | $43,838 | $135,720 |
| 2020 | $2,312 | $177,718 | $43,389 | $134,329 |
| 2019 | $2,264 | $174,235 | $42,539 | $131,696 |
| 2018 | $2,206 | $170,819 | $41,705 | $129,114 |
| 2017 | $2,092 | $167,471 | $40,888 | $126,583 |
| 2016 | $2,041 | $164,188 | $40,087 | $124,101 |
| 2015 | $2,005 | $161,722 | $39,485 | $122,237 |
| 2014 | $1,960 | $158,555 | $38,712 | $119,843 |
Source: Public Records
Map
Nearby Homes
- 7922 Collins Isle Ln
- 7788 River Landing Dr
- 4 Marina Blue Ct
- 827 Lake Front Dr
- 22 Basil Ct
- 462 de Mar Dr
- 4 Bingham Cir
- 52415-52979 S River Rd
- 22 Waterfront Ct
- 7656 Marina Cove Dr
- 7371 Windbridge Dr
- 7717 E Port Dr
- 1 Sandpointe Ct
- 14 Morningsun Ct
- 28 Genoa Ct
- 16 Sand River Ct
- 763 La Contenta Way
- 1078 La Fleur Way
- 7262 Harbor Light Way
- 1100 La Fleur Way
- 687 Cullivan Dr
- 7666 Blackwater Way
- 683 Cullivan Dr
- 7671 Blackwater Way
- 686 Cullivan Dr
- 7676 Blackwater Way
- 7662 Blackwater Way
- 7667 Blackwater Way
- 701 Cullivan Dr
- 679 Cullivan Dr
- 7677 Blackwater Way
- 682 Cullivan Dr
- 7680 Blackwater Way
- 7651 Kavooras Dr
- 700 Cullivan Dr
- 7663 Blackwater Way
- 7658 Blackwater Way
- 7655 Kavooras Dr
- 705 Cullivan Dr
- 7659 Blackwater Way