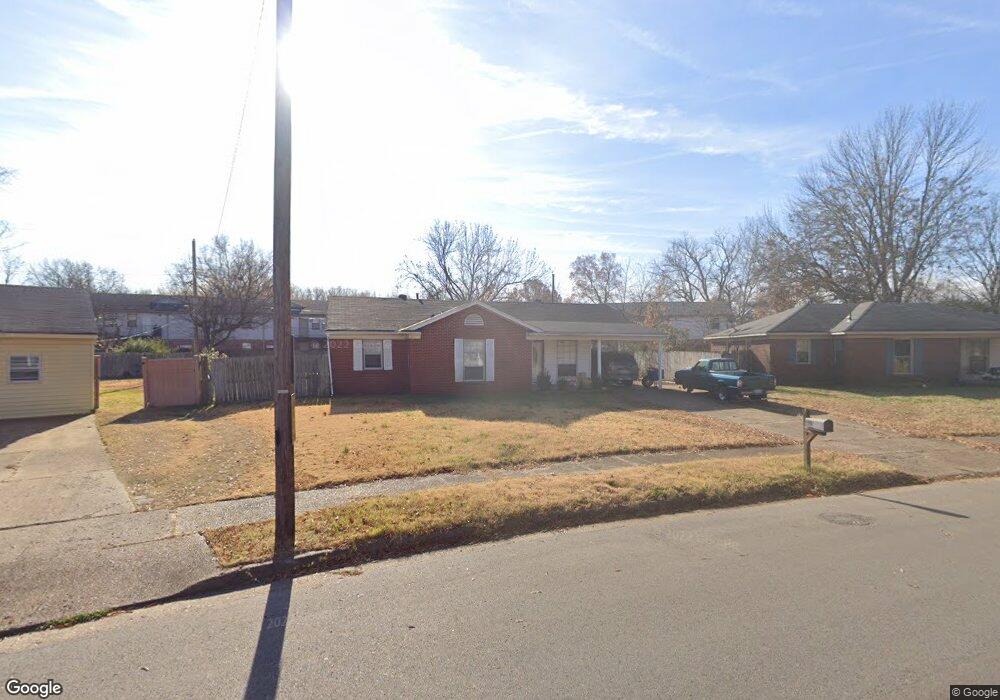
7670 Tecumseh St Millington, TN 38053
Estimated Value: $165,993 - $179,000
3
Beds
2
Baths
1,213
Sq Ft
$143/Sq Ft
Est. Value
About This Home
This home is located at 7670 Tecumseh St, Millington, TN 38053 and is currently estimated at $172,998, approximately $142 per square foot. 7670 Tecumseh St is a home located in Shelby County with nearby schools including Millington Elementary School, Millington High School, and Lighthouse Christian Academy.
Ownership History
Date
Name
Owned For
Owner Type
Purchase Details
Closed on
Aug 19, 2005
Sold by
Harper Patricia D and Wakefield Paul
Bought by
Wakefield Paul A and Wakefield Patricia D
Current Estimated Value
Home Financials for this Owner
Home Financials are based on the most recent Mortgage that was taken out on this home.
Original Mortgage
$70,000
Outstanding Balance
$37,992
Interest Rate
6.18%
Mortgage Type
New Conventional
Estimated Equity
$135,006
Purchase Details
Closed on
Apr 6, 1998
Sold by
Light Chuck H
Bought by
Harper Patricia D and Wakefield Paul
Home Financials for this Owner
Home Financials are based on the most recent Mortgage that was taken out on this home.
Original Mortgage
$61,963
Interest Rate
7.09%
Mortgage Type
FHA
Purchase Details
Closed on
Mar 11, 1998
Sold by
Light Leasa R
Bought by
Light Chuck Haskell
Home Financials for this Owner
Home Financials are based on the most recent Mortgage that was taken out on this home.
Original Mortgage
$61,963
Interest Rate
7.09%
Mortgage Type
FHA
Create a Home Valuation Report for This Property
The Home Valuation Report is an in-depth analysis detailing your home's value as well as a comparison with similar homes in the area
Home Values in the Area
Average Home Value in this Area
Purchase History
| Date | Buyer | Sale Price | Title Company |
|---|---|---|---|
| Wakefield Paul A | -- | Heritage Title Services Llc | |
| Harper Patricia D | $62,000 | -- | |
| Light Chuck Haskell | -- | -- |
Source: Public Records
Mortgage History
| Date | Status | Borrower | Loan Amount |
|---|---|---|---|
| Open | Wakefield Paul A | $70,000 | |
| Closed | Harper Patricia D | $61,963 |
Source: Public Records
Tax History Compared to Growth
Tax History
| Year | Tax Paid | Tax Assessment Tax Assessment Total Assessment is a certain percentage of the fair market value that is determined by local assessors to be the total taxable value of land and additions on the property. | Land | Improvement |
|---|---|---|---|---|
| 2025 | $839 | $40,075 | $5,475 | $34,600 |
| 2024 | $2,031 | $29,950 | $4,175 | $25,775 |
| 2023 | $1,435 | $29,950 | $4,175 | $25,775 |
| 2022 | $1,435 | $29,950 | $4,175 | $25,775 |
| 2021 | $1,453 | $29,950 | $4,175 | $25,775 |
| 2020 | $1,115 | $19,975 | $4,175 | $15,800 |
| 2019 | $809 | $19,975 | $4,175 | $15,800 |
| 2018 | $1,115 | $19,975 | $4,175 | $15,800 |
| 2017 | $1,127 | $19,975 | $4,175 | $15,800 |
| 2016 | $1,183 | $20,050 | $0 | $0 |
| 2014 | $876 | $20,050 | $0 | $0 |
Source: Public Records
Map
Nearby Homes
- 7727 Tecumseh St
- 7288 U S Highway 51
- 0000 U S Highway 51
- 8852 U S 51
- 4655 Doris Cir S
- 4690 Montgomery Rd
- 7988 Royster Creek Dr E
- 7994 Royster Creek Dr E
- 4721 Janie Ave
- 4741 Janie Ave
- 7963 Royster Creek Dr
- 7955 Royster Creek Dr
- 7943 Royster Creek Dr
- 5852 U S Highway 51
- 7988 Royster Creek Dr
- 7932 Royster Creek Dr
- 7942 Royster Creek Dr
- 7980 Royster Creek Dr
- 7994 Royster Creek Dr
- 4752 Janie Cove
- 7666 Tecumseh St
- 7674 Tecumseh St
- 7678 Tecumseh St
- 7662 Tecumseh St
- 7667 Tecumseh St
- 7677 Tecumseh St
- 7682 Tecumseh St
- 7660 Tecumseh St
- 7681 Tecumseh St
- 7668 Tecumseh St
- 7686 Tecumseh St
- 7674 Arapaho St
- 7685 Tecumseh St
- 7656 Arapaho St
- 7680 Arapaho St
- 7648 Arapaho St
- 7689 Tecumseh St
- 4571 Wampum Rd
- 7684 Arapaho St
- 4585 Wampum Rd