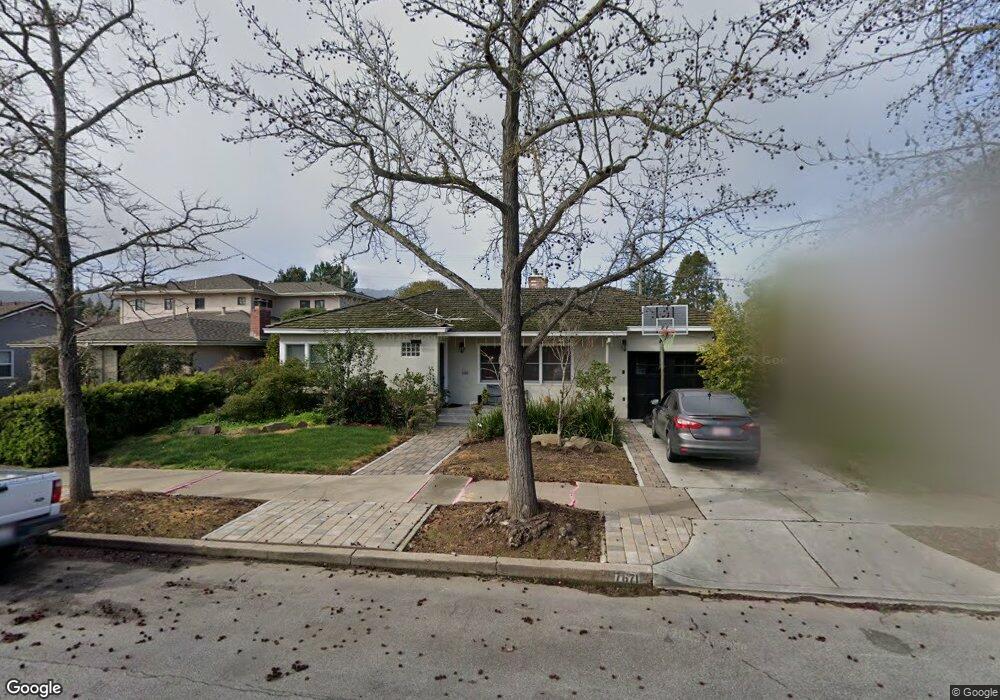
7671 Princevalle St Gilroy, CA 95020
Estimated Value: $897,000 - $1,029,000
3
Beds
2
Baths
1,532
Sq Ft
$644/Sq Ft
Est. Value
About This Home
This home is located at 7671 Princevalle St, Gilroy, CA 95020 and is currently estimated at $985,925, approximately $643 per square foot. 7671 Princevalle St is a home located in Santa Clara County with nearby schools including El Roble Elementary School, Brownell Middle School, and Solorsano Middle School.
Ownership History
Date
Name
Owned For
Owner Type
Purchase Details
Closed on
Nov 6, 2020
Sold by
Zanger Charles
Bought by
Zanger Charles
Current Estimated Value
Home Financials for this Owner
Home Financials are based on the most recent Mortgage that was taken out on this home.
Original Mortgage
$317,300
Outstanding Balance
$226,732
Interest Rate
2.3%
Mortgage Type
New Conventional
Estimated Equity
$759,193
Purchase Details
Closed on
Jun 22, 2017
Sold by
Zanger Charles and Zanger Jonene
Bought by
Zanger Charles
Home Financials for this Owner
Home Financials are based on the most recent Mortgage that was taken out on this home.
Original Mortgage
$424,100
Interest Rate
3.95%
Mortgage Type
New Conventional
Purchase Details
Closed on
Jul 7, 2010
Sold by
Pacific Capital Bank N A
Bought by
Zanger Charles and Zanger Jonene
Purchase Details
Closed on
Apr 14, 2009
Sold by
Baroni Dolores W
Bought by
Baroni Dolores W
Create a Home Valuation Report for This Property
The Home Valuation Report is an in-depth analysis detailing your home's value as well as a comparison with similar homes in the area
Home Values in the Area
Average Home Value in this Area
Purchase History
| Date | Buyer | Sale Price | Title Company |
|---|---|---|---|
| Zanger Charles | -- | Orange Coast Title | |
| Zanger Charles | -- | Orange Coast Title Company | |
| Zanger Charles | $410,000 | Chicago Title Company | |
| Baroni Dolores W | -- | None Available |
Source: Public Records
Mortgage History
| Date | Status | Borrower | Loan Amount |
|---|---|---|---|
| Open | Zanger Charles | $317,300 | |
| Previous Owner | Zanger Charles | $424,100 |
Source: Public Records
Tax History Compared to Growth
Tax History
| Year | Tax Paid | Tax Assessment Tax Assessment Total Assessment is a certain percentage of the fair market value that is determined by local assessors to be the total taxable value of land and additions on the property. | Land | Improvement |
|---|---|---|---|---|
| 2025 | $6,839 | $565,723 | $243,416 | $322,307 |
| 2024 | $6,839 | $554,632 | $238,644 | $315,988 |
| 2023 | $6,797 | $543,758 | $233,965 | $309,793 |
| 2022 | $6,684 | $533,097 | $229,378 | $303,719 |
| 2021 | $6,757 | $522,645 | $224,881 | $297,764 |
| 2020 | $6,579 | $517,287 | $222,576 | $294,711 |
| 2019 | $6,516 | $507,145 | $218,212 | $288,933 |
| 2018 | $6,169 | $497,202 | $213,934 | $283,268 |
| 2017 | $6,299 | $487,454 | $209,740 | $277,714 |
| 2016 | $6,171 | $477,897 | $205,628 | $272,269 |
| 2015 | $5,823 | $470,720 | $202,540 | $268,180 |
| 2014 | $5,787 | $461,500 | $198,573 | $262,927 |
Source: Public Records
Map
Nearby Homes
- 7681 Rea St
- 7630 Hanna St
- 7691 Church St Unit B
- 194 4th St
- 286 5th St
- 7391 Princevalle St Unit Homesite 13
- 7376 Ailes Ct Unit Homesite 10
- 7379 Ailes Ct Unit Homesite 3
- 7359 Princevalle St Unit Homesite 17
- 7360 Ailes Ct Unit Homesite 8
- 7363 Ailes Ct Unit Homesite 5
- 7351 Princevalle St Unit Homesite 18
- 7352 Ailes Ct Unit Homesite 7
- Plan 2 at Heritage on 6th Street
- Plan 1 at Heritage on 6th Street
- 7711 Monterey St
- 7343 Princevalle St Unit Homesite 19
- 970 Ortega Cir
- 0 Monterey Rd
- 7245 Trenton Place
- 7661 Princevalle St
- 7681 Princevalle St
- 7651 Princevalle St
- 7691 Princevalle St
- 7641 Princevalle St
- 7670 Rea St
- 7660 Rea St
- 7680 Rea St
- 7650 Rea St
- 7660 Princevalle St
- 7670 Princevalle St
- 720 3rd St
- 7650 Princevalle St
- 7631 Princevalle St
- 7640 Rea St
- 7680 Princevalle St
- 7640 Princevalle St
- 7630 Rea St
- 7711 Princevalle St
- 7630 Princevalle St