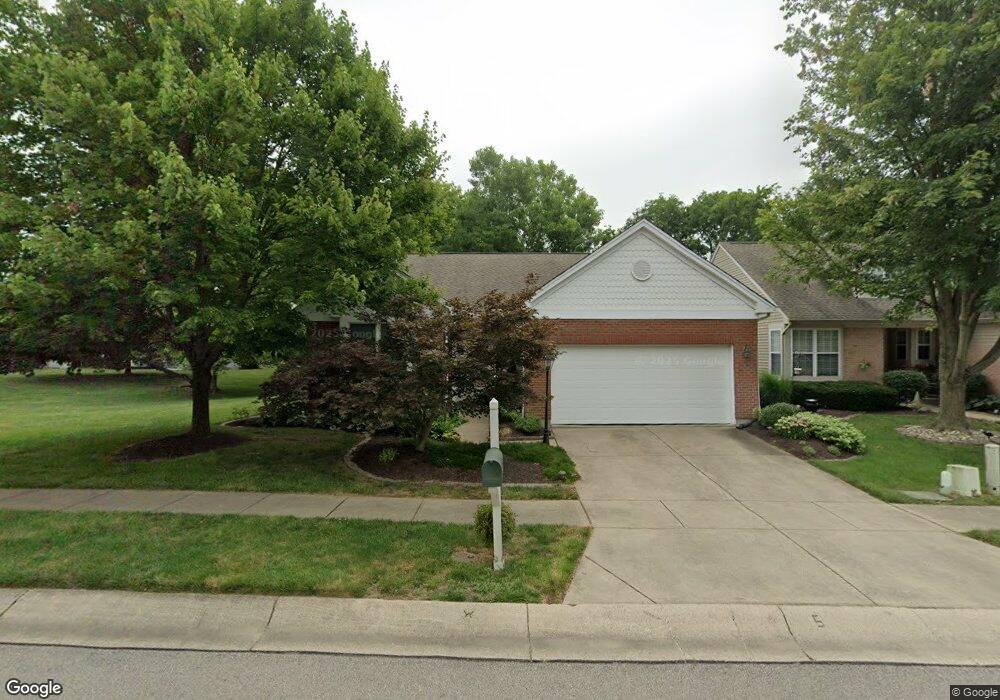
7672 Crystal Cove Pointe Maineville, OH 45039
Estimated Value: $378,379 - $471,000
2
Beds
2
Baths
3,956
Sq Ft
$104/Sq Ft
Est. Value
About This Home
This home is located at 7672 Crystal Cove Pointe, Maineville, OH 45039 and is currently estimated at $411,595, approximately $104 per square foot. 7672 Crystal Cove Pointe is a home located in Warren County with nearby schools including Little Miami Early Childhood Center, Little Miami Intermediate Middle School, and Little Miami Middle School.
Ownership History
Date
Name
Owned For
Owner Type
Purchase Details
Closed on
Jan 23, 2012
Sold by
Fryant John L and Fryant Sharon R
Bought by
Fryant John L and Fryant Sharon R
Current Estimated Value
Home Financials for this Owner
Home Financials are based on the most recent Mortgage that was taken out on this home.
Original Mortgage
$122,000
Outstanding Balance
$82,013
Interest Rate
3.88%
Mortgage Type
New Conventional
Estimated Equity
$329,582
Purchase Details
Closed on
Jan 25, 1999
Sold by
R & R Assoc
Bought by
Fryant John L and Fryant Sharon R
Home Financials for this Owner
Home Financials are based on the most recent Mortgage that was taken out on this home.
Original Mortgage
$143,900
Interest Rate
6.76%
Mortgage Type
New Conventional
Purchase Details
Closed on
Mar 13, 1997
Sold by
Village On The Green Ltd
Bought by
R & R Assoc
Home Financials for this Owner
Home Financials are based on the most recent Mortgage that was taken out on this home.
Original Mortgage
$137,000
Interest Rate
7.95%
Mortgage Type
New Conventional
Create a Home Valuation Report for This Property
The Home Valuation Report is an in-depth analysis detailing your home's value as well as a comparison with similar homes in the area
Home Values in the Area
Average Home Value in this Area
Purchase History
| Date | Buyer | Sale Price | Title Company |
|---|---|---|---|
| Fryant John L | -- | Grandview Title Services Llc | |
| Fryant John L | -- | Brandview Title Services Llc | |
| Fryant John L | $179,905 | -- | |
| R & R Assoc | $27,500 | -- |
Source: Public Records
Mortgage History
| Date | Status | Borrower | Loan Amount |
|---|---|---|---|
| Open | Fryant John L | $122,000 | |
| Closed | Fryant John L | $122,000 | |
| Closed | Fryant John L | $143,900 | |
| Previous Owner | R & R Assoc | $137,000 |
Source: Public Records
Tax History
| Year | Tax Paid | Tax Assessment Tax Assessment Total Assessment is a certain percentage of the fair market value that is determined by local assessors to be the total taxable value of land and additions on the property. | Land | Improvement |
|---|---|---|---|---|
| 2025 | $4,946 | $120,180 | $26,250 | $93,930 |
| 2024 | $4,946 | $120,180 | $26,250 | $93,930 |
| 2023 | $4,481 | $98,003 | $16,800 | $81,203 |
| 2022 | $4,430 | $98,004 | $16,800 | $81,204 |
| 2021 | $4,224 | $98,004 | $16,800 | $81,204 |
| 2020 | $4,045 | $81,669 | $14,000 | $67,669 |
| 2019 | $4,112 | $81,669 | $14,000 | $67,669 |
| 2018 | $3,972 | $81,669 | $14,000 | $67,669 |
| 2017 | $3,342 | $69,419 | $12,569 | $56,851 |
| 2016 | $3,421 | $69,419 | $12,569 | $56,851 |
| 2015 | $3,417 | $69,419 | $12,569 | $56,851 |
| 2014 | $3,653 | $66,110 | $11,970 | $54,140 |
| 2013 | $3,541 | $77,320 | $14,000 | $63,320 |
Source: Public Records
Map
Nearby Homes
- 7682 Crystal Cove Pointe
- 7576 Lake Pointe
- 7409 Wildberry Ct
- 845 Village Green Pkwy
- 1247 Eagle Blvd
- 1255 Eagle Blvd
- 1204 Eagle Blvd
- 1180 Eagle Blvd
- 1491 Wexler Ct
- 1358 Brookchase Cir
- DaVinci Plan at Salt Run Preserve - Maple Street Collection
- Charles Plan at Salt Run Preserve - Designer Collection
- Yosemite Plan at Salt Run Preserve - Maple Street Collection
- Emmett Plan at Salt Run Preserve - Designer Collection
- Breckenridge Plan at Salt Run Preserve - Maple Street Collection
- Carrington Plan at Salt Run Preserve - Designer Collection
- Grandin Plan at Salt Run Preserve - Designer Collection
- Cumberland Plan at Salt Run Preserve - Maple Street Collection
- Harper Plan at Salt Run Preserve - Maple Street Collection
- Winston Plan at Salt Run Preserve - Designer Collection
- 7672 Crystal Cove Point
- 7682 Crystal Cove Point
- 7690 Crystal Cove Point
- 7690 Crystal Cove Pointe
- 7719 Squirrel Run
- 7721 Squirrel Run
- 7723 Squirrel Run
- 7700 Crystal Cove Point
- 7700 Crystal Cove Pointe
- 7677 Squirrel Run
- 7727 Squirrel Run
- 7675 Squirrel Run
- 7729 Squirrel Run
- 7710 Crystal Cove Point
- 7731 Squirrel Run
- 7703 Crystal Cove Pointe
- 7703 Crystal Cove Point
- 7669 Squirrel Run
- 7672 Squirrel Run
- 7678 Squirrel Run
Your Personal Tour Guide
Ask me questions while you tour the home.