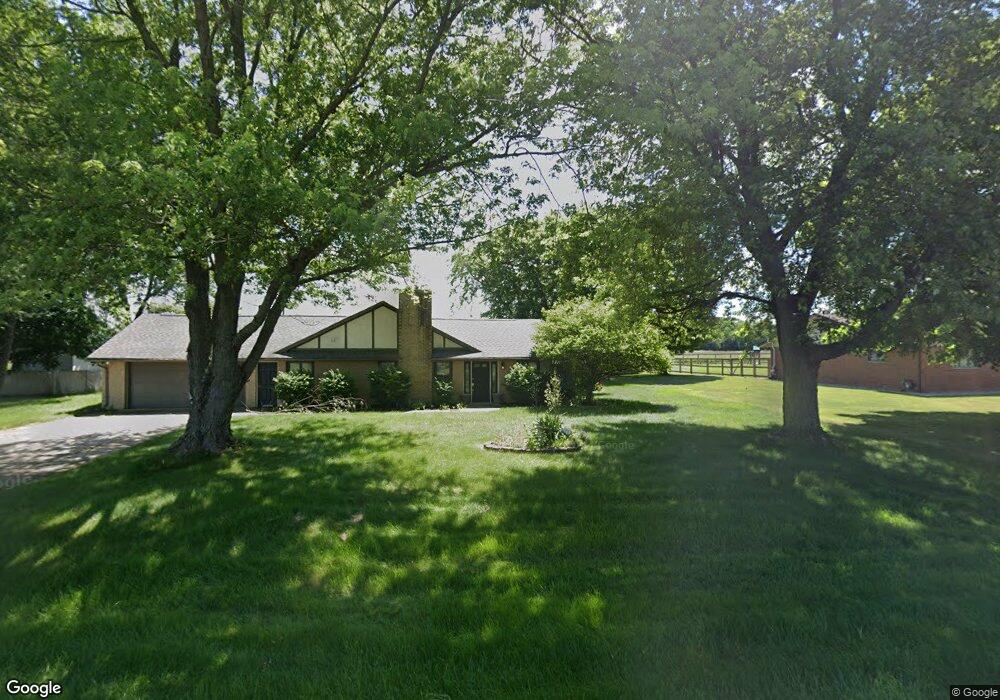
7677 Peters Rd Tipp City, OH 45371
Estimated Value: $274,000 - $363,000
3
Beds
2
Baths
1,740
Sq Ft
$180/Sq Ft
Est. Value
About This Home
This home is located at 7677 Peters Rd, Tipp City, OH 45371 and is currently estimated at $313,496, approximately $180 per square foot. 7677 Peters Rd is a home located in Miami County with nearby schools including Broadway Elementary School, Nevin Coppock Elementary School, and L. T. Ball Intermediate School.
Ownership History
Date
Name
Owned For
Owner Type
Purchase Details
Closed on
Dec 13, 2021
Sold by
Gioiello Danya K
Bought by
Gioiello Danette K
Current Estimated Value
Purchase Details
Closed on
Dec 1, 2021
Sold by
Gioiello Danya K
Bought by
Gioiello Danette K
Purchase Details
Closed on
Oct 15, 2015
Sold by
Miller Terry L and Miller Linda F
Bought by
Gioiello Danya K
Home Financials for this Owner
Home Financials are based on the most recent Mortgage that was taken out on this home.
Original Mortgage
$136,000
Interest Rate
3.82%
Mortgage Type
New Conventional
Purchase Details
Closed on
Oct 18, 1995
Sold by
Owen E Lynn
Bought by
Miller Terry L and Miller Linda F
Home Financials for this Owner
Home Financials are based on the most recent Mortgage that was taken out on this home.
Original Mortgage
$106,400
Interest Rate
7.68%
Mortgage Type
New Conventional
Create a Home Valuation Report for This Property
The Home Valuation Report is an in-depth analysis detailing your home's value as well as a comparison with similar homes in the area
Home Values in the Area
Average Home Value in this Area
Purchase History
| Date | Buyer | Sale Price | Title Company |
|---|---|---|---|
| Gioiello Danette K | -- | Kordik James G | |
| Gioiello Danette K | -- | Kordik James G | |
| Gioiello Danette K | -- | Kordik James G | |
| Gioiello Danya K | $170,000 | Attorney | |
| Miller Terry L | $112,000 | -- |
Source: Public Records
Mortgage History
| Date | Status | Borrower | Loan Amount |
|---|---|---|---|
| Previous Owner | Gioiello Danya K | $136,000 | |
| Previous Owner | Miller Terry L | $106,400 |
Source: Public Records
Tax History Compared to Growth
Tax History
| Year | Tax Paid | Tax Assessment Tax Assessment Total Assessment is a certain percentage of the fair market value that is determined by local assessors to be the total taxable value of land and additions on the property. | Land | Improvement |
|---|---|---|---|---|
| 2024 | $3,859 | $71,860 | $17,500 | $54,360 |
| 2023 | $3,859 | $71,860 | $17,500 | $54,360 |
| 2022 | $3,548 | $71,860 | $17,500 | $54,360 |
| 2021 | $2,743 | $53,200 | $12,950 | $40,250 |
| 2020 | $2,777 | $53,200 | $12,950 | $40,250 |
| 2019 | $2,801 | $53,200 | $12,950 | $40,250 |
| 2018 | $2,716 | $48,060 | $10,190 | $37,870 |
| 2017 | $2,726 | $48,060 | $10,190 | $37,870 |
| 2016 | $2,614 | $48,060 | $10,190 | $37,870 |
| 2015 | $2,274 | $42,910 | $9,100 | $33,810 |
| 2014 | $2,274 | $42,910 | $9,100 | $33,810 |
| 2013 | $2,285 | $42,910 | $9,100 | $33,810 |
Source: Public Records
Map
Nearby Homes
- 7585 Peters Rd
- 1111 Lightner Rd
- 8202 Cherry Birch Dr
- 260 Kent Rd
- 6940 Bejay Dr
- 6060 Detrick Rd
- 6690 S County Road 25a
- The Prescott Plan at Fieldstone Place
- The Lynwood Plan at Emerson Crossing
- The Concord Plan at Emerson Crossing
- The Magnolia Plan at Fieldstone Place
- The Cambridge Plan at Emerson Crossing
- The Sandalwood Plan at Fieldstone Place
- The Lincoln Plan at Emerson Crossing
- The Plainfield Plan at Fieldstone Place
- The Cambridge Plan at Fieldstone Place
- The Magnolia Plan at Emerson Crossing
- The Prescott Plan at Emerson Crossing
- The Fieldstone Plan at Emerson Crossing
- The Zink Plan at Fieldstone Place
- 7665 Peters Rd
- 7705 Peters Rd
- 7635 Peters Rd
- 7690 Peters Rd
- 0 Peters Pike Unit 756687
- 0 Peters Pike Unit 407085
- 7620 Peters Rd
- 7733 Peters Rd
- 7755 Peters Rd
- 7590 Peters Rd
- 7715 Peters Rd
- 7555 Peters Rd
- 1440 Ginghamsburg Frederick Rd
- 1420 Ginghamsburg Frederick Rd
- 1530 Ginghamsburg Frederick Rd
- 1390 Ginghamsburg Rd
- 1670 Ginghamsburg Frederick Rd
- 1370 Ginghamsburg Rd
- 7855 Peters Rd
- 1477 Ginghamsburg-Frederick Rd