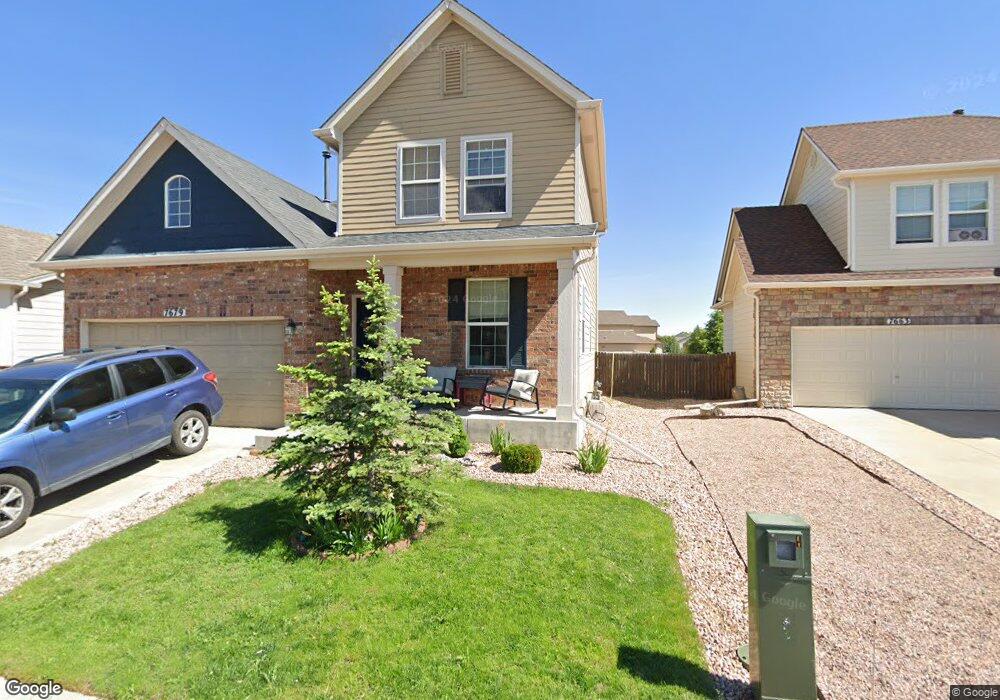
7679 Eolus Grove Peyton, CO 80831
Falcon NeighborhoodEstimated Value: $354,072 - $378,000
3
Beds
3
Baths
1,286
Sq Ft
$286/Sq Ft
Est. Value
About This Home
This home is located at 7679 Eolus Grove, Peyton, CO 80831 and is currently estimated at $368,268, approximately $286 per square foot. 7679 Eolus Grove is a home located in El Paso County with nearby schools including Woodmen Hills Elementary School, Falcon Middle School, and Falcon High School.
Ownership History
Date
Name
Owned For
Owner Type
Purchase Details
Closed on
Apr 16, 2020
Sold by
Ray Zachary D and Ray Chanel K
Bought by
Ray Zachary D and Ray Chanel K
Current Estimated Value
Purchase Details
Closed on
May 10, 2016
Sold by
Braxton Jeffrey W
Bought by
Ray Zachary D and Hase Chanel K
Home Financials for this Owner
Home Financials are based on the most recent Mortgage that was taken out on this home.
Original Mortgage
$178,703
Outstanding Balance
$146,023
Interest Rate
4.5%
Mortgage Type
FHA
Estimated Equity
$222,245
Purchase Details
Closed on
Jun 24, 2005
Sold by
Pulte Home Corp
Bought by
Braxton Jeffrey W
Home Financials for this Owner
Home Financials are based on the most recent Mortgage that was taken out on this home.
Original Mortgage
$184,327
Interest Rate
5.63%
Mortgage Type
FHA
Create a Home Valuation Report for This Property
The Home Valuation Report is an in-depth analysis detailing your home's value as well as a comparison with similar homes in the area
Home Values in the Area
Average Home Value in this Area
Purchase History
| Date | Buyer | Sale Price | Title Company |
|---|---|---|---|
| Ray Zachary D | -- | None Available | |
| Ray Zachary D | $182,000 | Legacy Title | |
| Braxton Jeffrey W | $187,222 | Land Title Guarantee Company |
Source: Public Records
Mortgage History
| Date | Status | Borrower | Loan Amount |
|---|---|---|---|
| Open | Ray Zachary D | $178,703 | |
| Previous Owner | Braxton Jeffrey W | $184,327 |
Source: Public Records
Tax History
| Year | Tax Paid | Tax Assessment Tax Assessment Total Assessment is a certain percentage of the fair market value that is determined by local assessors to be the total taxable value of land and additions on the property. | Land | Improvement |
|---|---|---|---|---|
| 2025 | $1,442 | $23,810 | -- | -- |
| 2024 | $1,336 | $24,210 | $3,020 | $21,190 |
| 2022 | $1,195 | $17,210 | $2,850 | $14,360 |
| 2021 | $1,243 | $17,710 | $2,930 | $14,780 |
| 2020 | $1,048 | $14,870 | $2,650 | $12,220 |
| 2019 | $1,039 | $14,870 | $2,650 | $12,220 |
| 2018 | $916 | $12,890 | $2,660 | $10,230 |
| 2017 | $839 | $12,890 | $2,660 | $10,230 |
| 2016 | $865 | $13,110 | $2,950 | $10,160 |
| 2015 | $866 | $13,110 | $2,950 | $10,160 |
| 2014 | $802 | $11,920 | $2,950 | $8,970 |
Source: Public Records
Map
Nearby Homes
- 7682 Capel Point
- 11893 Trissino Heights
- 7630 Old Spec Rd
- 7544 Jaoul Point
- 11856 Gorman Grove
- 7612 Bullet Rd
- 11820 Pei Grove
- 7636 Bullet Rd
- 7524 Stephenville Rd
- 7660 Bullet Rd
- 7394 Owings Point
- 11455 Owl Place
- 7860 Gladwater Rd
- 11485 Owl Place
- 11751 Sedge Ct
- 11763 Sedge Ct
- 11572 Farnese Heights
- 11605 Avena Rd
- 7514 Teocalli Point
- 11449 Moonrock Heights
- 7695 Eolus Grove
- 7663 Eolus Grove
- 7647 Eolus Grove
- 7696 Eolus Grove
- 7699 Bierstadt Heights
- 7664 Eolus Grove
- 7648 Eolus Grove
- 7689 Bierstadt Heights
- 7665 Capel Point
- 7712 Mclaughlin Rd
- 7669 Bierstadt Heights
- 7649 Capel Point
- 7681 Capel Point
- 7633 Capel Point
- 7649 Bierstadt Heights
- 7772 Coffee Rd
- 7639 Bierstadt Heights
- 7760 Coffee Rd
- 7784 Coffee Rd
- 7724 Mclaughlin Rd