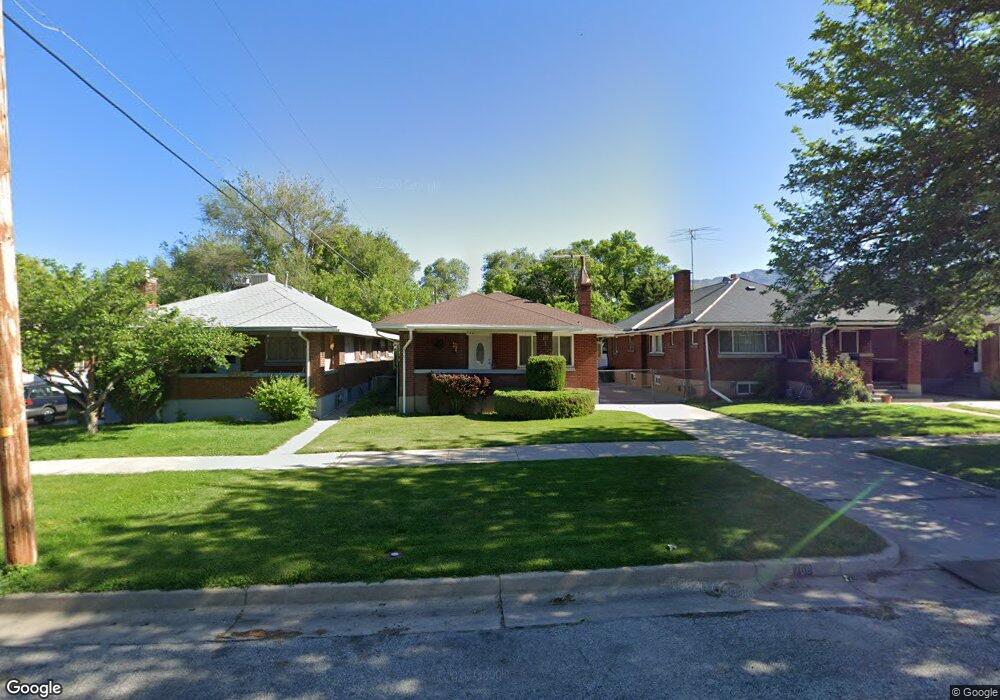
768 28th St Ogden, UT 84403
TO Smith NeighborhoodEstimated Value: $319,414 - $378,000
2
Beds
2
Baths
1,252
Sq Ft
$277/Sq Ft
Est. Value
About This Home
This home is located at 768 28th St, Ogden, UT 84403 and is currently estimated at $346,354, approximately $276 per square foot. 768 28th St is a home located in Weber County with nearby schools including Mound Fort Junior High School, Ogden High School, and St Joseph Catholic School.
Ownership History
Date
Name
Owned For
Owner Type
Purchase Details
Closed on
Jun 18, 2024
Sold by
Romero Adriana
Bought by
Boyso Armando Romero
Current Estimated Value
Purchase Details
Closed on
Jul 8, 2019
Sold by
Aparicio Albino and Aparicio Laura
Bought by
Romero Adriana and Boyso Armando Romero
Purchase Details
Closed on
Dec 18, 2015
Sold by
Aparicio Albino and Aparicio Antonio
Bought by
Aparicio Albino and Aparicio Laura
Home Financials for this Owner
Home Financials are based on the most recent Mortgage that was taken out on this home.
Original Mortgage
$40,000
Interest Rate
3.96%
Mortgage Type
Purchase Money Mortgage
Purchase Details
Closed on
Jun 26, 1997
Sold by
Olson Regina D
Bought by
Aparicio Albino and Aparicio Antonio
Home Financials for this Owner
Home Financials are based on the most recent Mortgage that was taken out on this home.
Original Mortgage
$60,750
Interest Rate
7.92%
Purchase Details
Closed on
Apr 8, 1997
Sold by
Dowey James A
Bought by
Olson Regina D
Create a Home Valuation Report for This Property
The Home Valuation Report is an in-depth analysis detailing your home's value as well as a comparison with similar homes in the area
Home Values in the Area
Average Home Value in this Area
Purchase History
| Date | Buyer | Sale Price | Title Company |
|---|---|---|---|
| Boyso Armando Romero | -- | Freedom Title Insurance Agency | |
| Romero Adriana | -- | None Available | |
| Aparicio Albino | -- | Accommodation | |
| Aparicio Albino | -- | -- | |
| Olson Regina D | -- | -- |
Source: Public Records
Mortgage History
| Date | Status | Borrower | Loan Amount |
|---|---|---|---|
| Previous Owner | Aparicio Albino | $40,000 | |
| Previous Owner | Aparicio Albino | $60,750 |
Source: Public Records
Tax History
| Year | Tax Paid | Tax Assessment Tax Assessment Total Assessment is a certain percentage of the fair market value that is determined by local assessors to be the total taxable value of land and additions on the property. | Land | Improvement |
|---|---|---|---|---|
| 2025 | $2,384 | $349,493 | $109,565 | $239,928 |
| 2024 | $2,417 | $191,397 | $60,260 | $131,137 |
| 2023 | $2,319 | $184,800 | $53,508 | $131,292 |
| 2022 | $2,575 | $205,700 | $48,131 | $157,569 |
| 2021 | $1,983 | $263,000 | $47,273 | $215,727 |
| 2020 | $1,502 | $184,000 | $36,837 | $147,163 |
| 2019 | $1,400 | $161,000 | $31,728 | $129,272 |
| 2018 | $1,313 | $150,001 | $25,702 | $124,299 |
| 2017 | $1,124 | $120,000 | $25,702 | $94,298 |
| 2016 | $1,022 | $58,954 | $11,360 | $47,594 |
| 2015 | $933 | $52,507 | $11,360 | $41,147 |
| 2014 | $950 | $52,506 | $11,360 | $41,146 |
Source: Public Records
Map
Nearby Homes
Your Personal Tour Guide
Ask me questions while you tour the home.