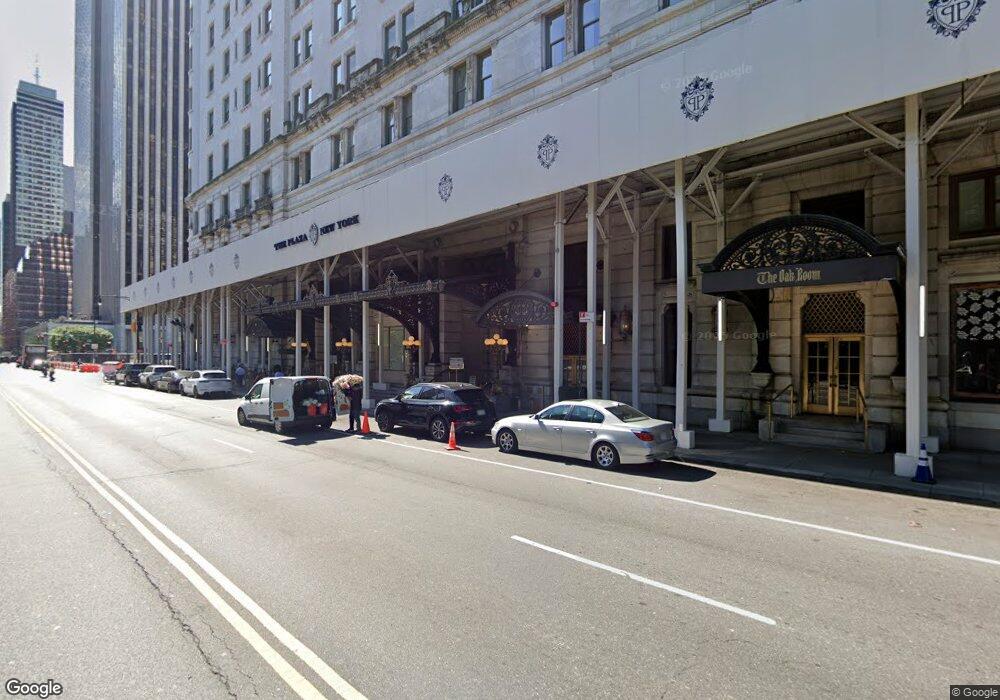
The Plaza 768 5th Ave Unit 1804 New York, NY 10019
Midtown NeighborhoodEstimated Value: $1,824,000 - $3,485,000
--
Bed
--
Bath
1,208
Sq Ft
$2,122/Sq Ft
Est. Value
About This Home
This home is located at 768 5th Ave Unit 1804, New York, NY 10019 and is currently estimated at $2,563,005, approximately $2,121 per square foot. 768 5th Ave Unit 1804 is a home located in New York County with nearby schools including P.S. 111 Adolph S. Ochs, Clinton School, and Middle School 297.
Ownership History
Date
Name
Owned For
Owner Type
Purchase Details
Closed on
Oct 17, 2018
Sold by
Dinesh C Paliwal Ila Paliwal 2012 Irrev and Trust
Bought by
Aasheesh Paliwal Trust and Dinesh Paliwal Trustee
Current Estimated Value
Purchase Details
Closed on
Dec 17, 2012
Sold by
Paliwal Dinesh and Paliwal Ila
Bought by
Dinesh C Paliwal Trustee Of The Dinesh C and And Ila Paliwal 2012 Irrevocable Trust
Purchase Details
Closed on
Dec 5, 2012
Sold by
Estate Of Rose Gutmacher and Olshan Frome %
Bought by
Paliwal Dinesh and Paliwal Ila
Purchase Details
Closed on
Mar 11, 2008
Sold by
Plaza Residential Owner Lp
Bought by
Gutmacher Rose
Home Financials for this Owner
Home Financials are based on the most recent Mortgage that was taken out on this home.
Original Mortgage
$2,730,000
Interest Rate
5.76%
Mortgage Type
Purchase Money Mortgage
Create a Home Valuation Report for This Property
The Home Valuation Report is an in-depth analysis detailing your home's value as well as a comparison with similar homes in the area
Home Values in the Area
Average Home Value in this Area
Purchase History
| Date | Buyer | Sale Price | Title Company |
|---|---|---|---|
| Aasheesh Paliwal Trust | -- | -- | |
| Dinesh C Paliwal Trustee Of The Dinesh C | -- | -- | |
| Dinesh C Paliwal Trustee Of The Dinesh C | -- | -- | |
| Paliwal Dinesh | $2,537,500 | -- | |
| Paliwal Dinesh | $2,537,500 | -- | |
| Gutmacher Rose | $3,422,790 | -- | |
| Gutmacher Rose | $3,422,790 | -- |
Source: Public Records
Mortgage History
| Date | Status | Borrower | Loan Amount |
|---|---|---|---|
| Previous Owner | Gutmacher Rose | $2,730,000 |
Source: Public Records
Tax History Compared to Growth
Tax History
| Year | Tax Paid | Tax Assessment Tax Assessment Total Assessment is a certain percentage of the fair market value that is determined by local assessors to be the total taxable value of land and additions on the property. | Land | Improvement |
|---|---|---|---|---|
| 2025 | $28,962 | $241,323 | $51,969 | $189,354 |
| 2024 | $28,962 | $231,655 | $51,969 | $179,686 |
| 2023 | $22,722 | $224,515 | $51,969 | $172,546 |
| 2022 | $22,147 | $233,143 | $51,969 | $181,174 |
| 2021 | $26,347 | $224,955 | $51,969 | $172,986 |
| 2020 | $21,465 | $222,365 | $51,969 | $170,396 |
| 2019 | $25,861 | $222,370 | $51,969 | $170,401 |
| 2018 | $24,106 | $216,811 | $51,968 | $164,843 |
| 2017 | $22,845 | $216,050 | $51,969 | $164,081 |
| 2016 | $21,393 | $190,589 | $51,969 | $138,620 |
| 2015 | $12,105 | $190,483 | $51,969 | $138,514 |
| 2014 | $12,105 | $158,530 | $51,969 | $106,561 |
Source: Public Records
About The Plaza
Map
Nearby Homes
- 1 Central Park S Unit 1406
- 1 Central Park S Unit 1701/04/06
- 1 Central Park S Unit 702
- 1 Central Park S Unit MANSION201
- 1 Central Park S Unit 1904
- 1 Central Park S Unit 1801/03
- 1 Central Park S Unit 1513
- 1 Central Park S Unit 1013
- 1 Central Park S Unit PH11
- 1 Central Park S Unit 1907
- 1 Central Park S Unit 1336
- 1 Central Park S Unit 507
- 1 Central Park S Unit 910
- 1 Central Park S Unit 1813
- 1 Central Park S Unit 1126
- 1 Central Park S Unit 1804
- 1 Central Park S Unit 701
- 1 Central Park S Unit 409
- 1 Central Park S Unit 506
- 1 Central Park S Unit 1707
- 768 5th Ave Unit 1805
- 768 5th Ave Unit 2015
- 768 5th Ave Unit 2011
- 768 5th Ave Unit 2009
- 768 5th Ave Unit 2006
- 768 5th Ave Unit 2003
- 768 5th Ave Unit 2002
- 768 5th Ave Unit 2001
- 768 5th Ave Unit 1915
- 768 5th Ave Unit 1907
- 768 5th Ave Unit 1906
- 768 5th Ave Unit 1904
- 768 5th Ave Unit 1903
- 768 5th Ave Unit 1901
- 768 5th Ave Unit 1813
- 768 5th Ave Unit 1811
- 768 5th Ave Unit 1810
- 768 5th Ave Unit 1809
- 768 5th Ave Unit 1807
- 768 5th Ave Unit 1806