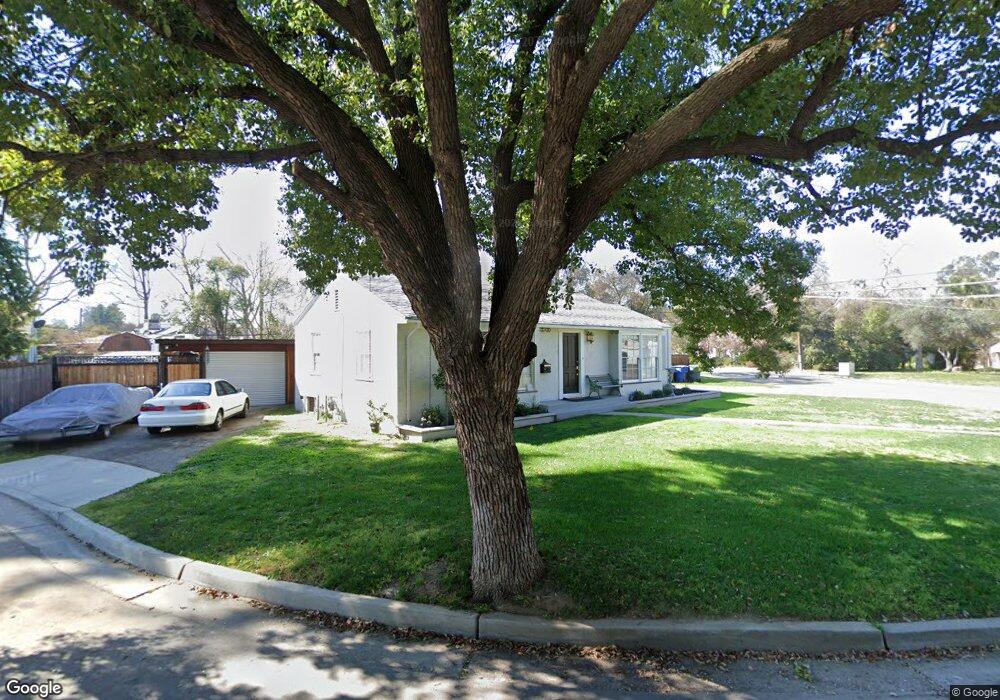
768 E Lansing Way Fresno, CA 93704
Maroa NeighborhoodEstimated Value: $298,000 - $363,000
3
Beds
2
Baths
1,190
Sq Ft
$278/Sq Ft
Est. Value
About This Home
This home is located at 768 E Lansing Way, Fresno, CA 93704 and is currently estimated at $330,616, approximately $277 per square foot. 768 E Lansing Way is a home located in Fresno County with nearby schools including Powers-Ginsburg Elementary, Bullard High School, and Aspen Meadow Public School.
Ownership History
Date
Name
Owned For
Owner Type
Purchase Details
Closed on
Mar 4, 2020
Sold by
Lamarche Frank S and Lamarche Frank Stephen
Bought by
Lamarche Frank S
Current Estimated Value
Home Financials for this Owner
Home Financials are based on the most recent Mortgage that was taken out on this home.
Original Mortgage
$175,010
Outstanding Balance
$155,347
Interest Rate
3.62%
Mortgage Type
FHA
Estimated Equity
$175,269
Purchase Details
Closed on
Mar 3, 2015
Sold by
Afifi Marc and Afifi Felicia K
Bought by
Lamarche Frank Stephen
Home Financials for this Owner
Home Financials are based on the most recent Mortgage that was taken out on this home.
Original Mortgage
$112,800
Interest Rate
3.64%
Mortgage Type
New Conventional
Purchase Details
Closed on
Dec 16, 1993
Sold by
Richardson Alvina J
Bought by
Afifi Marc and Afifi Felicia K
Home Financials for this Owner
Home Financials are based on the most recent Mortgage that was taken out on this home.
Original Mortgage
$85,129
Interest Rate
7.21%
Mortgage Type
FHA
Create a Home Valuation Report for This Property
The Home Valuation Report is an in-depth analysis detailing your home's value as well as a comparison with similar homes in the area
Home Values in the Area
Average Home Value in this Area
Purchase History
| Date | Buyer | Sale Price | Title Company |
|---|---|---|---|
| Lamarche Frank S | -- | Fidelity National Title Co | |
| Lamarche Frank Stephen | $141,000 | Chicago Title | |
| Afifi Marc | $85,000 | North American Title Co Inc |
Source: Public Records
Mortgage History
| Date | Status | Borrower | Loan Amount |
|---|---|---|---|
| Open | Lamarche Frank S | $175,010 | |
| Previous Owner | Lamarche Frank Stephen | $112,800 | |
| Previous Owner | Afifi Marc | $85,129 |
Source: Public Records
Tax History Compared to Growth
Tax History
| Year | Tax Paid | Tax Assessment Tax Assessment Total Assessment is a certain percentage of the fair market value that is determined by local assessors to be the total taxable value of land and additions on the property. | Land | Improvement |
|---|---|---|---|---|
| 2025 | $2,132 | $169,449 | $42,059 | $127,390 |
| 2023 | $2,009 | $162,872 | $40,427 | $122,445 |
| 2022 | $1,980 | $159,680 | $39,635 | $120,045 |
| 2021 | $1,924 | $156,550 | $38,858 | $117,692 |
| 2020 | $1,933 | $154,946 | $38,460 | $116,486 |
| 2019 | $1,858 | $151,908 | $37,706 | $114,202 |
| 2018 | $1,886 | $148,930 | $36,967 | $111,963 |
| 2017 | $1,854 | $146,011 | $36,243 | $109,768 |
| 2016 | $1,793 | $143,149 | $35,533 | $107,616 |
| 2015 | $1,511 | $120,188 | $39,588 | $80,600 |
| 2014 | $1,480 | $117,835 | $38,813 | $79,022 |
Source: Public Records
Map
Nearby Homes
- 625 E Lansing Way
- 1020 E Saginaw Way
- 4012 N Wishon Ave
- 935 E Fedora Ave
- 1135 E Lansing Way
- 3640 N Van Ness Blvd
- 3606 N College Ave
- 1305 E Fedora Ave
- 4175 N Van Ness Blvd
- 311 E Dayton Ave
- 1406 E Hampton Way
- 1405 E Cortland Ave
- 4121 N Palm Ave
- 3688 N Harrison Ave
- 4266 N College Ave
- 94 E Sussex Way
- 311 E Andrews Ave
- 216 E Ashlan Ave
- 4355 N College Ave
- 1115 E Cornell Ave
- 802 E Lansing Way
- 744 E Lansing Way
- 824 E Lansing Way
- 808 E Lansing Way
- 769 E Lansing Way
- 809 E Lansing Way
- 751 E Lansing Way
- 816 E Lansing Way
- 738 E Lansing Way
- 825 E Lansing Way
- 739 E Lansing Way
- 838 E Lansing Way
- 724 E Lansing Way
- 3817 N Maroa Ave
- 736 E Lansing Way
- 770 E Saginaw Way
- 839 E Lansing Way
- 810 E Saginaw Way
- 752 E Saginaw Way
- 725 E Lansing Way